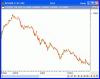

As I noted earlier on the SOX, we have a crescendo of volume. The latest set of 3 black crows doesn't look to me to be anywhere near a selling climax. Steady increases in volume as we scale lower and lower... Here's the SOX chart with volumes...
SOX CHART w/Volumes - 3 Black Crow Crescendo
SB,
Am I wrong, or isn't it usually the case that the so-called momentum bottom with your crescendo volume usually precedes the price bottom on lessening volume as the selling is clearly drying up? If so, we had the high volume momentum bottom last week and are now having the lower volume price bottom this past week and possibly into early next week.
MT
Wyckoff said tops and bottoms are not made on volume... that's my take... from a relative perspective, we're still developing mo .. volume that is... so perhaps when we can tick under this on some lighter volume day we can reverse it....
You just lost me again. We've just ticked lower, about only three points on SOX, from the prior week's low, on signficantly lower volume (about 20% lower daily volume on SMH this week from prior week, which should approximate SOX volume), and positive divergences on the NAMO, RSI, CCI, MACD, you name it, and still you still think that momentum is increasing and not decreasing? Please explain.


