 Z
Z

Ok we have a consensus !
Started by
NAV
, Apr 05 2009 12:28 PM
20 replies to this topic
#11

zoropb
-

- Traders-Talk User
- 8,392 posts
Member
Posted 05 April 2009 - 01:32 PM
"but not yet as big as 30s is what i mean't"
ah ok
yeah but why bother comparing the two once we are down 80% we will all know it then
Z
Z
Love, be kind to one another, seek the truth, walk the narrow path between the ying and the yang.
#12
Woody
-

- Traders-Talk User
- 1,498 posts
Member
Posted 05 April 2009 - 01:35 PM
I favor the idea of a brief pullback then a rally to Jan highs at 944 which will coincide with 200 ema in a few weeks;
...and then a drop that either gives back 80% of the advance (722) or new lows
more rally from here gives those who panicked and sold a chance to feel good about getting long again, and for those who stayed long a chance to pat themselves on the back, this will take some time.
Looks like there are enough EWave counts to staisfy both Bears and Bulls...... 
#13
zoropb
-
- Traders-Talk User
- 8,392 posts
Member
Posted 05 April 2009 - 01:40 PM
I favor the idea of a brief pullback then a rally to Jan highs at 944 which will coincide with 200 ema in a few weeks;
...and then a drop that either gives back 80% of the advance (722) or new lows
more rally from here gives those who panicked and sold a chance to feel good about getting long again, and for those who stayed long a chance to pat themselves on the back, this will take some time.
Looks like there are enough EWave counts to staisfy both Bears and Bulls......
Woody
...'enough EWave counts to staisfy both Bears and Bulls' loved that oneI got target two... 946 if 920 gets taken out. a very sneaky 2 points away from yours
Z
Love, be kind to one another, seek the truth, walk the narrow path between the ying and the yang.
#14
humble1
-

- Traders-Talk User
- 5,959 posts
Member
Posted 05 April 2009 - 01:45 PM
it's good to see that NAV and RODO are still bearish!
#15
NAV
-
- Traders-Talk User
- 16,087 posts
Member
Posted 05 April 2009 - 01:47 PM
946 if 920 gets taken out.
Z
You can take this to the bank. If 946 is taken out, then 947 is next !
#16
zoropb
-
- Traders-Talk User
- 8,392 posts
Member
Posted 05 April 2009 - 01:49 PM
946 if 920 gets taken out.
Z
You can take this to the bank. If 946 is taken out, then 947 is next !
Man that area is getting to crowded now may have to go to 941 now
Love, be kind to one another, seek the truth, walk the narrow path between the ying and the yang.
#17
VolPivots
-

- Chartist
- 3,203 posts
Member
Posted 05 April 2009 - 02:48 PM
Just a general roadmap that remains on track
The analog (posted 2/27) and again below...this is redline "internal accumulation" wave A of 4 that lasts into next spring (ideally 977 SPX).
Longer-term, I'm starting to think more like the Japan path....i.e. secular bear doesn't terminate next year as the chart suggests but later post 2011 Option Arms/Alt-A resets.....there's still a ton of incomplete systematic cleansing (i.e. get off the debt drug...and changing mindsets of our fearless leaders) the months/quarters/ and years-end before the next secular bull commences
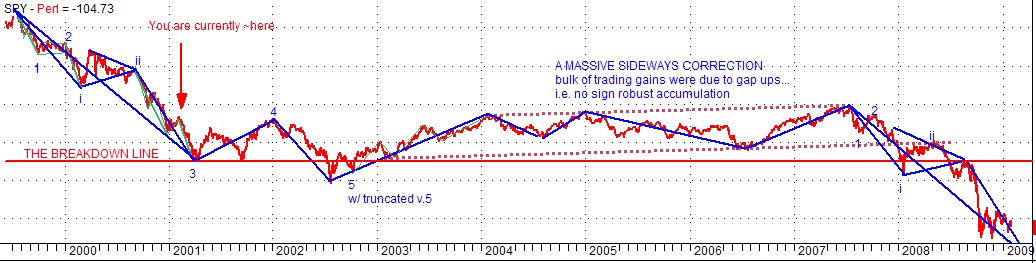
Near-by price levels to watch:
Broad-based basket of stocks, still below resistance, about 3.5% higher (870-5 SPX):
09FF
IT pic bullish into middle/2nd half of this month, though long in the tooth and options data quite bothersome. bearish afterwards into quad-ex. most impressive rally we've seen yet commences shortly afterwards followed by a sell in May and go away and play. IT bottom 2nd half Sep into Oct.....longest IT duration rally lasting into Spring10.
MN 1/1/2009
The analog (posted 2/27) and again below...this is redline "internal accumulation" wave A of 4 that lasts into next spring (ideally 977 SPX).
Longer-term, I'm starting to think more like the Japan path....i.e. secular bear doesn't terminate next year as the chart suggests but later post 2011 Option Arms/Alt-A resets.....there's still a ton of incomplete systematic cleansing (i.e. get off the debt drug...and changing mindsets of our fearless leaders) the months/quarters/ and years-end before the next secular bull commences
Near-by price levels to watch:
Broad-based basket of stocks, still below resistance, about 3.5% higher (870-5 SPX):
Edited by marketneutral, 05 April 2009 - 02:55 PM.
#18
IYB
-

- TT Patron+
- 7,146 posts
Member
Posted 05 April 2009 - 03:27 PM
I posted here on March 7 (repeated below) that all of the ingredients were in place for an IT rally and that all we needed was the thrust itself, which would be manifest by an SSBS at some point. Then on March 10, that SSBS occurred and I posted that the IT advance had begun. I stand by that, fwiw. Call me concensus if you wish, but I still see this as an IT advance in a primary bear market.
What I believe we are seeing now is simply what I call the POR- the "point of recognition" of this IT advance. I'm sure we'll see some shakeout ahead (perhaps dead ahead) to weaken that conviction, but the final stage- the stage where every decline gets bought, and bear market talk becomes a distant memory, is yet to come, all again, in my humble opinion. D
D
What I believe we are seeing now is simply what I call the POR- the "point of recognition" of this IT advance. I'm sure we'll see some shakeout ahead (perhaps dead ahead) to weaken that conviction, but the final stage- the stage where every decline gets bought, and bear market talk becomes a distant memory, is yet to come, all again, in my humble opinion.
DJust my thoughts on what record bearishness, and deep momentum divergences are telling us, as traders, and perhaps more importantly, what they are NOT telling us, fwiw.

Record AAII bearishness (in it's 25 year historical record) cannot and should not be ignored, imho. BUT....I've always maintained that sentiment alone cannot be used as a timing signal, per se, because it only measures potential for the next move, which is very important to monitor and know, but it still doesn't tell you WHEN the move will occur. IOW, while it's true that over the years, important bottoms have coincided with peak bearishness, the fact remains that in real time, we cannot know what the peak bearishness reading will be. 70% is a RECORD. That's highly significant. But will it peak here? Or at 75%? or 80%? Or 90%? We can't know.
Same with momentum divergences. I've just reviewed dozens (perhaps hundreds) of internal momentum measures, and I couldn't find a single one which has NOT held above the OCT/NOV 2008 lows (though I'm sure someone will point one or two out to me), as all of the major averages have now moved into new low ground. Many here will argue that this means nothing, just as many will maintain that record bearish sentiment readings mean nothing. I maintain that they tell us something very important: they tell us that the potential for a very meaningful IT rally is at hand. Again, a look back at market history shows important moves spring from big divergences- this market principal has been true for a hundred years and then some, and will be 100 years hence.
But here's the catch. Just like with sentiment, the divergences alone don't tell us when the move will begin. Will it start from here? Or 5% down? or 25% down? or more? We can't know.
So are record AAII bearishness and massive divergent readings in internal market momentum of no value to a trader? Far from it! They tell him two things...the potential size and duration of a subsequent move, and that the time has come to be alert to a trend change.
Now for the last piece of the puzzle....when? IMHO, we will know when the IT advance has begun when momentum itself turns up. Price follows momentum. I use SS's for that purpose. Other traders use different measures. Still others use pure price trends, and of course, that's a completely valid approach as well, as proven by sucessful traders here.
For now the trend is down, and that means shorting rallies is the profitable play for aggressive traders. Until the trend chnges that remains true. In fact, often the very best part of a trend occurs in just the last couple of days of that trend before it changes- implying that possibly the biggest trading profits from the short side still lie ahead.
But I just wanted to express my view, fwiw, about this age old argument, about the value of these technical tools-sentiment and divergences, and my view, again, fwiw, on how they should be viewed.
Good trading, D
Edited by IYB, 05 April 2009 - 03:28 PM.
Men, it has been well said, think in herds; it will be seen that they go mad in herds, while they only recover their senses slowly, one by one. ― Charles Mackay, Extraordinary Popular Delusions and the Madness of Crowds
#19
IYB
-
- TT Patron+
- 7,146 posts
Member
Posted 05 April 2009 - 04:04 PM
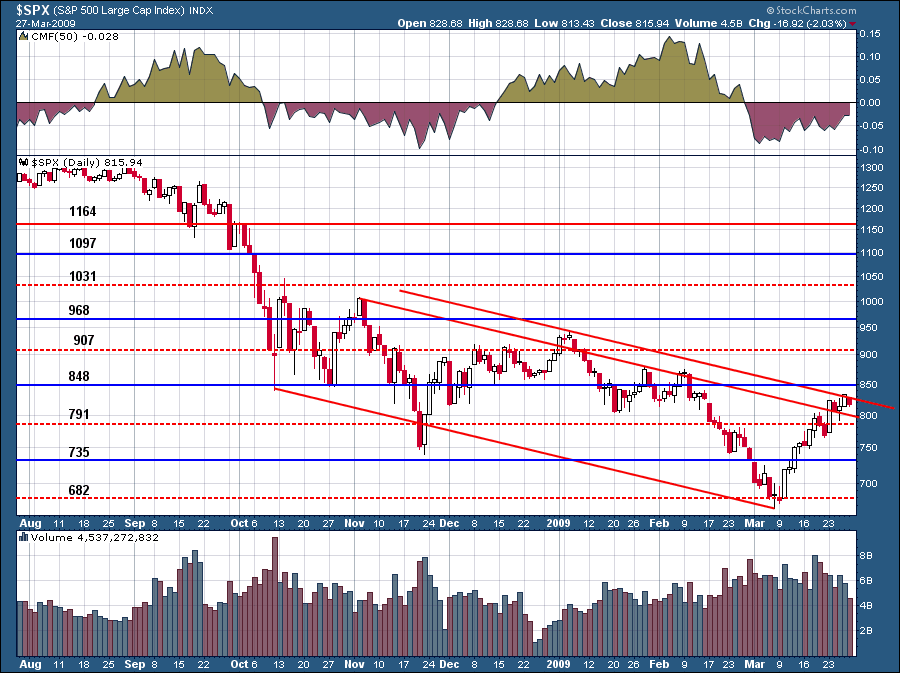
And this remains my target:
We'll see lots of clues as we go, especially in momentum readings, but IF this does blossom into a full blown IT rally....then where could we be headed? What's the best case? The 13 month MA will likely define the IT target.
The Long Term Chart gives us some clues. Just as in the 2000-2003 cyclical bear, where IT rallies were bounded by the 13 Month MA, a similar move here would take us to 950-1000 area, as that MA continues to fall over the next couple of months. There will be, as always, lots of twists and turns along the way...but that's how I see it.
Just some thoughts, fwiw.....Regards, D
http://stockcharts.com/c-sc/sc?s=$SPX&p=M&st=1980-01-28&i=p39183268817&a=149688849&r=5994.png
Just my thoughts on what record bearishness deep momentum divergences are telling us, as traders, and perhaps more importantly, what they are NOT telling us, fwiw.
Record AAII bearishness (in it's 25 year historical record) cannot and should not be ignored, imho...... 70% is a RECORD. That's highly significant. But will it peak here? Or at 75%? or 80%? Or 90%? We can't know.
Same with momentum divergences.... I couldn't find a single one which has NOT held above the OCT/NOV 2008 lows (though I'm sure someone will point one or two out to me
Now for the last piece of the puzzle....when? IMHO, we will know when the IT advance has begun when momentum itself turns up. Price follows momentum. I use SS's for that purpose....
Men, it has been well said, think in herds; it will be seen that they go mad in herds, while they only recover their senses slowly, one by one. ― Charles Mackay, Extraordinary Popular Delusions and the Madness of Crowds
#20
NAV
-
- Traders-Talk User
- 16,087 posts
Member
Posted 06 April 2009 - 03:11 AM
I posted here on March 7 (repeated below) that all of the ingredients were in place for an IT rally and that all we needed was the thrust itself, which would be manifest by an SSBS at some point. Then on March 10, that SSBS occurred and I posted that the IT advance had begun. I stand by that, fwiw. Call me concensus if you wish, but I still see this as an IT advance in a primary bear market.
What I believe we are seeing now is simply what I call the POR- the "point of recognition" of this IT advance. I'm sure we'll see some shakeout ahead (perhaps dead ahead) to weaken that conviction, but the final stage- the stage where every decline gets bought, and bear market talk becomes a distant memory, is yet to come, all again, in my humble opinion.
Just my thoughts on what record bearishness, and deep momentum divergences are telling us, as traders, and perhaps more importantly, what they are NOT telling us, fwiw.
Record AAII bearishness (in it's 25 year historical record) cannot and should not be ignored, imho. BUT....I've always maintained that sentiment alone cannot be used as a timing signal, per se, because it only measures potential for the next move, which is very important to monitor and know, but it still doesn't tell you WHEN the move will occur. IOW, while it's true that over the years, important bottoms have coincided with peak bearishness, the fact remains that in real time, we cannot know what the peak bearishness reading will be. 70% is a RECORD. That's highly significant. But will it peak here? Or at 75%? or 80%? Or 90%? We can't know.
Same with momentum divergences. I've just reviewed dozens (perhaps hundreds) of internal momentum measures, and I couldn't find a single one which has NOT held above the OCT/NOV 2008 lows (though I'm sure someone will point one or two out to me
But here's the catch. Just like with sentiment, the divergences alone don't tell us when the move will begin. Will it start from here? Or 5% down? or 25% down? or more? We can't know.
So are record AAII bearishness and massive divergent readings in internal market momentum of no value to a trader? Far from it! They tell him two things...the potential size and duration of a subsequent move, and that the time has come to be alert to a trend change.
Now for the last piece of the puzzle....when? IMHO, we will know when the IT advance has begun when momentum itself turns up. Price follows momentum. I use SS's for that purpose. Other traders use different measures. Still others use pure price trends, and of course, that's a completely valid approach as well, as proven by sucessful traders here.
For now the trend is down, and that means shorting rallies is the profitable play for aggressive traders. Until the trend chnges that remains true. In fact, often the very best part of a trend occurs in just the last couple of days of that trend before it changes- implying that possibly the biggest trading profits from the short side still lie ahead.
But I just wanted to express my view, fwiw, about this age old argument, about the value of these technical tools-sentiment and divergences, and my view, again, fwiw, on how they should be viewed.
Good trading, D
IYB,
Appreciate your view. Have your SS given a renewed buy signal or have you merely cancelled the sell signal that you got last week ?


