Crafting the rhythms series III, January 17 2012
By Fibo-Nacy
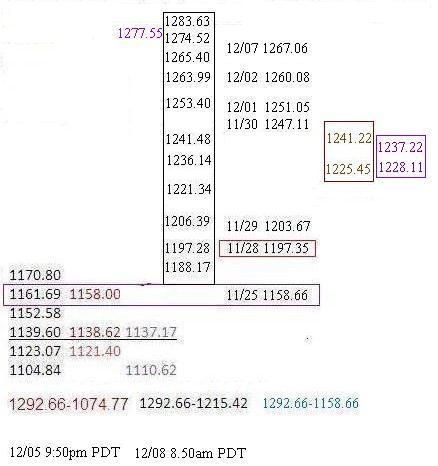
Retaking 1294, a profound development:
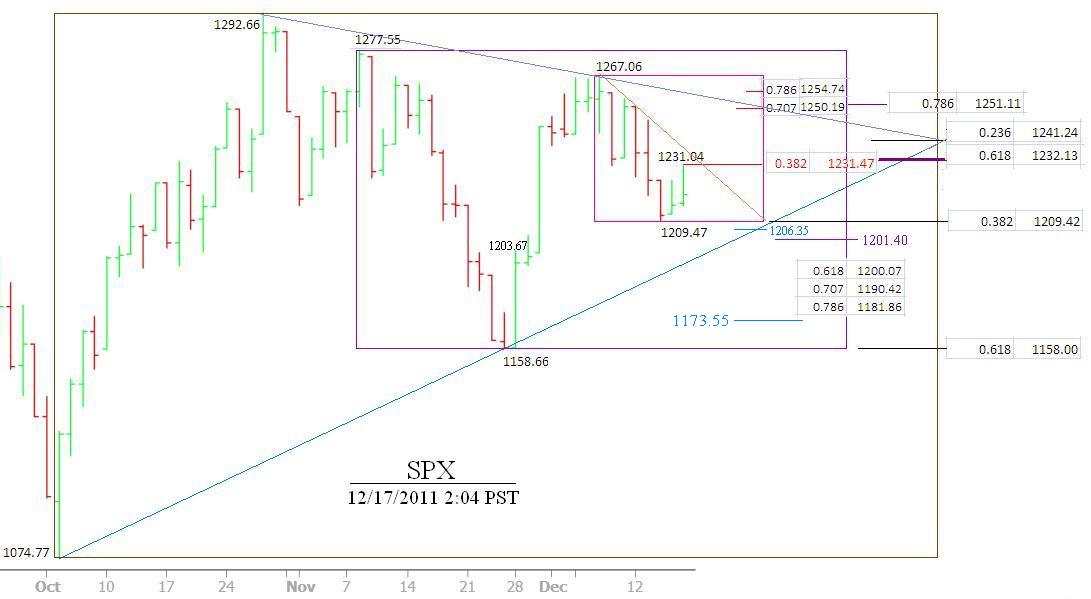
[1277.55-1256.79-1215.42] [bullish-neutral-bearish]
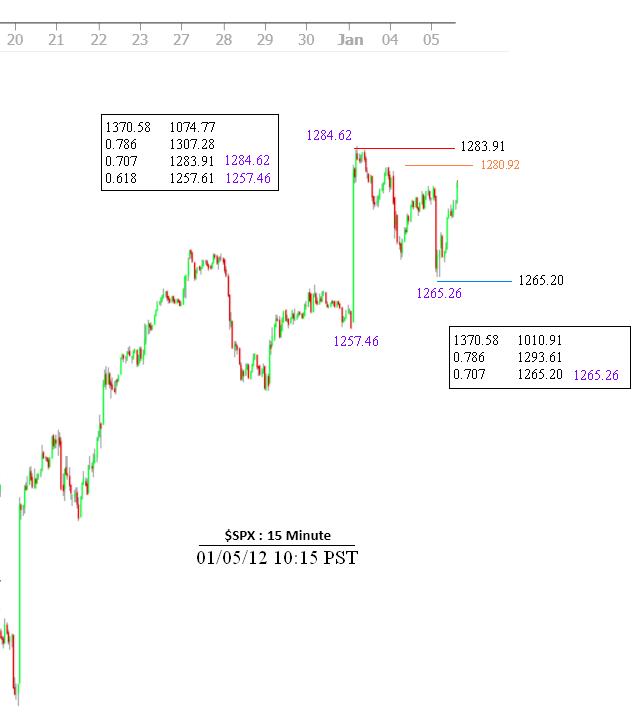
Index breaks 1277.55, enters the bullish territory, pokes into the Fibonacci cluster 1299.79-1315.64.
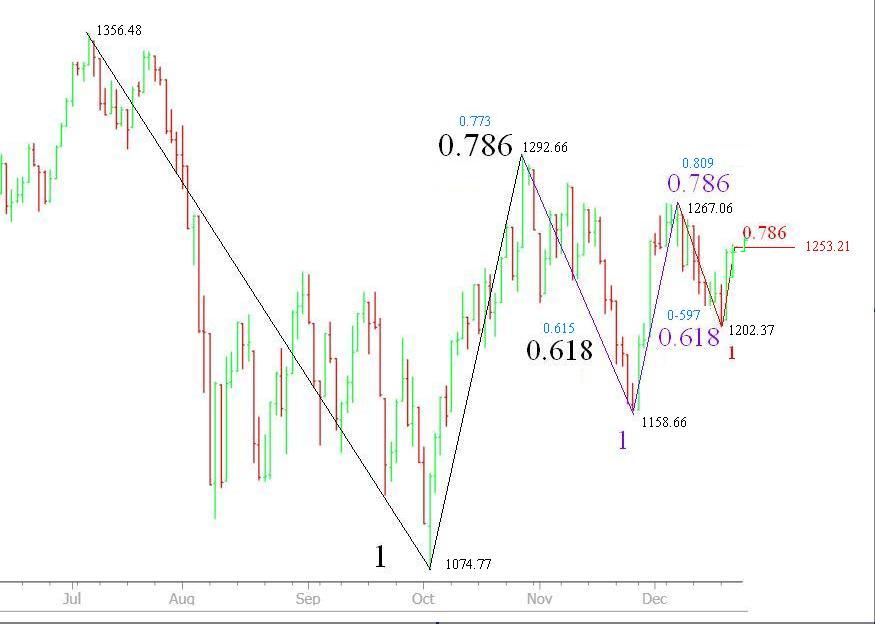
At this writing, 01/17/12 7:45 PST, the SPX index intraday high is 1303.00. it is the 0.809 retracement at 1302.67 in between [1356.48|1074.77]. [ refer to the prior post ]
Lets review a post released in August last year
Connecting the dots - 08/20/2011
by Fibo-Nacy & Stanley
link to the post
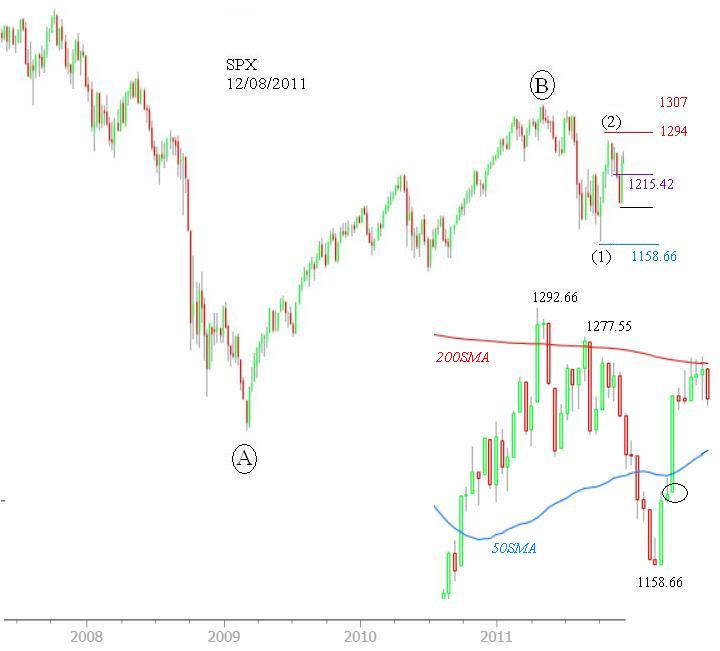
The termination of wave B? requires confirmation. One may use 1102 (0.382 1371-667) as a gauge
Wave count for reference only, it evolves with time.
link to the wave chart
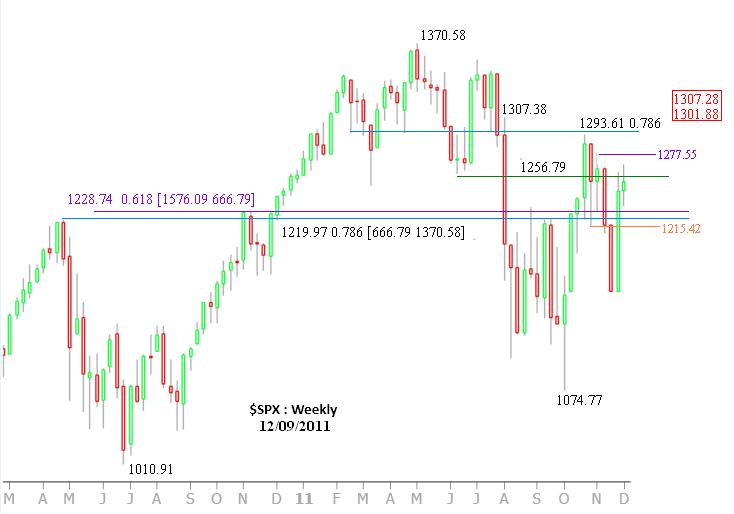
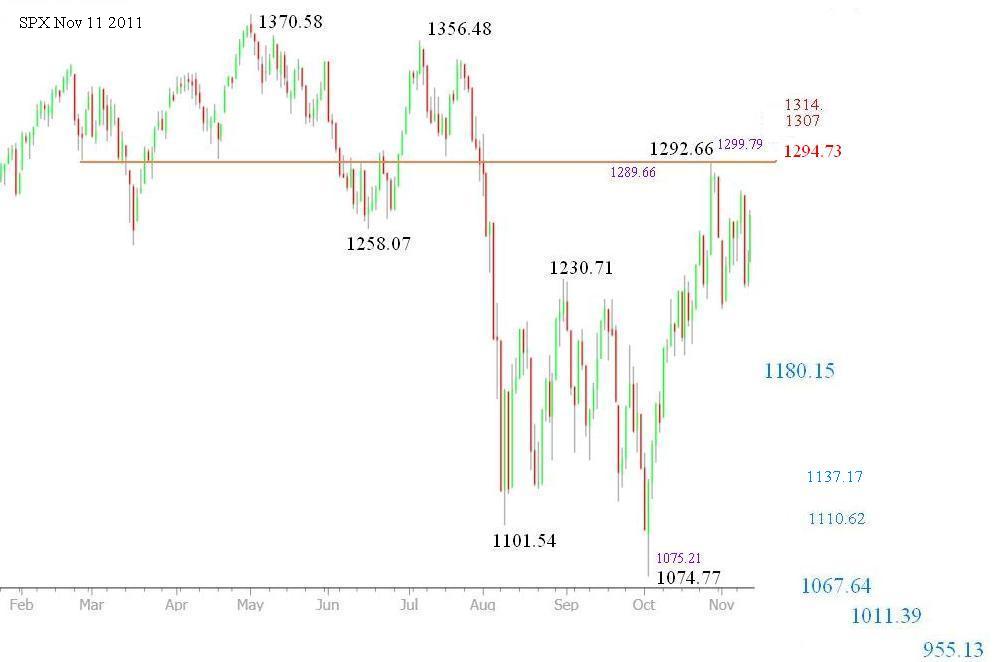
Even though the SPX index marked the low 1074.77 on 10/04/11, and that event satisfied the wave B? termination criteria, the reality that the index also re-claimed the important Fibonacci point 1293.61 (0.786, 1370.58 vs. 1010.91 ), this action implies a bullish set up.
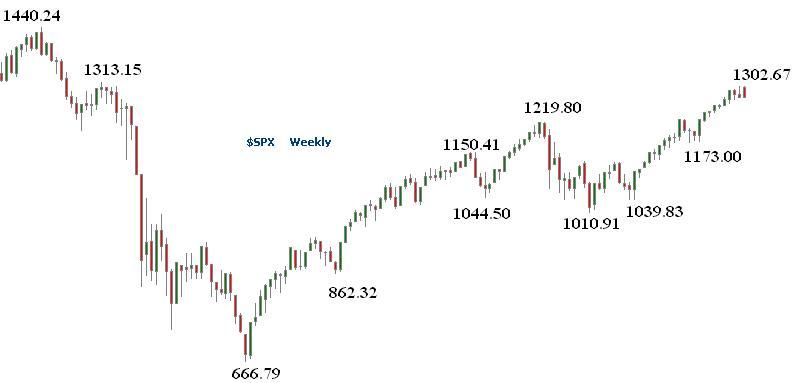
In case the index can hold the important support, in wave theory, it has the capability reaching 1440 level again.
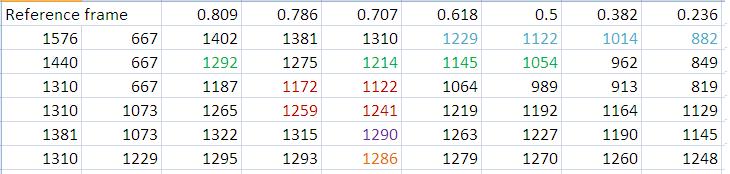
refer to this chart . the 0.809 retracement in between 1440.24 666.79 is 1292.51. perhaps, reaching 1440 is a pretty remote event, especially when there are so many on-going negative events floating around. I need to put the dice on the table.
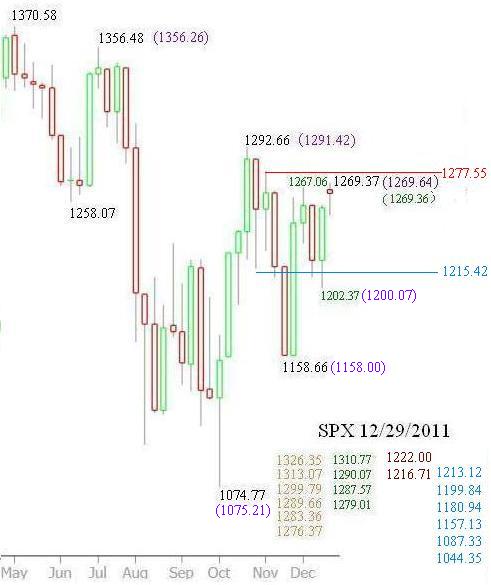
Here is the retracement table
The following chart gives the overall wave count picture, the reconciliation one is on the top, the lower one was posted in August last year.
(click to enlarge)

Recalls an old post back to April, 2010:
Stanley Apr 13 2010, 09:58 AM
link to the post
By surmounting 881 [see note], the wave hierarchy changes. The rally wave since March 6th becomes a major wave. Therefore, a primary wave B (Up, counter-trend) has commenced. It is at the same level as the wave from Oct/07 to March/09 (Primary A, Down).
[Note]:
881.38 = [0.236|666.79:1576.09] and 877= [0.618|1007:667]. The points between 877 [middle spring target] and 881 is small but by surmounting 881, the wave hierarchy changes
This is one of the example that a small difference (877 vs. 881) made the valid speculation. Now, SPX index reclaims the 1293.61 pivot with good margin ( 1303.00 vs. 1293.61 ), as a technician, I shall abide what I have seen & interpret the chart without bias. The interpretation could be wrong, yet, it is part of the process
Near term:
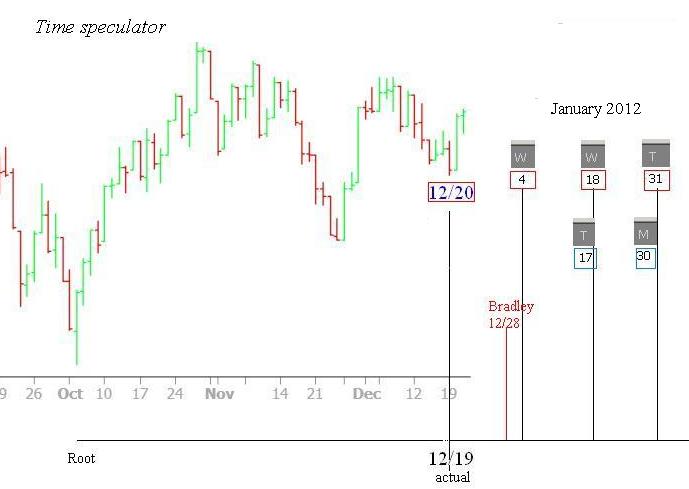
The King Wens sequence made the following speculation.
12/20,
01/04, 01/18(out), 01/31 [Low]
01/17, 01/30, 02/10 [high]
The low observed on 12/19 counting from 10/04 were 53 trading days, 54 is the shortest King Wen's sequence projected on to 12/20, it is hard to say that was the low date nailed by King Wen's sequence. coincidentally, Today's high (01/17, 1303.00) is 54th trading days from the last observed high date 10/27 (1292.66).
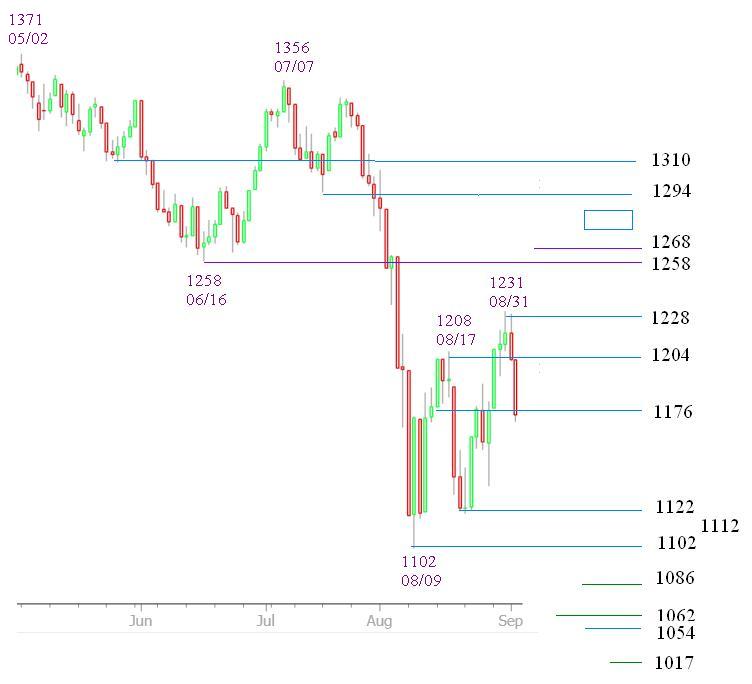
The 108 trading day cycle is due on 03/12/12. This cycle has recurred 4 times,
link to see the chart , will it recur the fifth times?? I don't know. I put a few key time counts and pullback supports in the chart, again 1215 ( 1213.5-1207.11 ) is the bearish gauge, critical supports are 1141.64, 1123.61 (early sign to dismiss the bullish scenario). watch the 69 trading day time windows in the chart, may be it is a good hint.
(click to enlarge)

background info:
Important Gann Trading day counts are 11, 22, 33, 45, 56, 67, 78, 90, 101, 112, 123, 135, 146, 157, 168 and 180 (
more details follow this link ); King Wen's sequence are : [81,126,63,108,90,99,54,117,72] (harmonics of 108, not in a sequential order). The 108 trading day cycle theoretical value is 105== 100 * PI /3.


