Crafting the rhythms series II, November 25, 2011
Title:
Connecting flight to 2012
By Fibo-Nacy [Stanley is working in the Far East, He asked me to continue his work]
Brief review
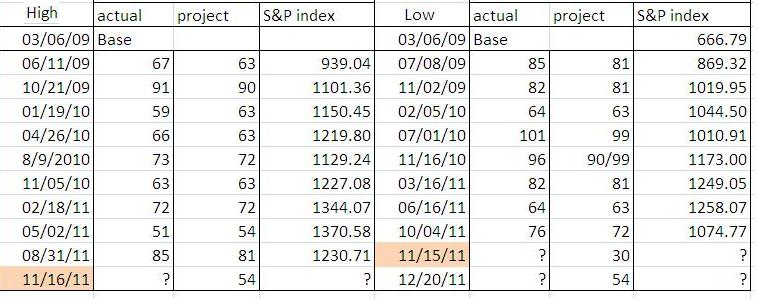
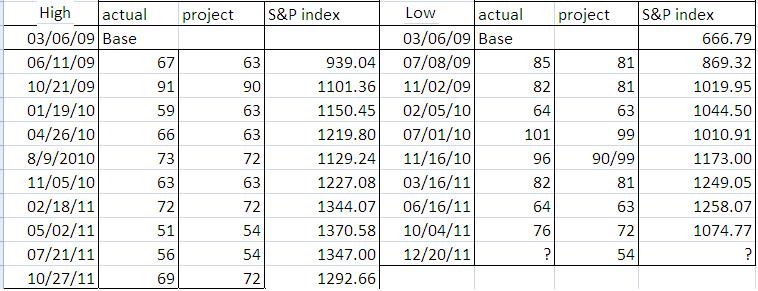
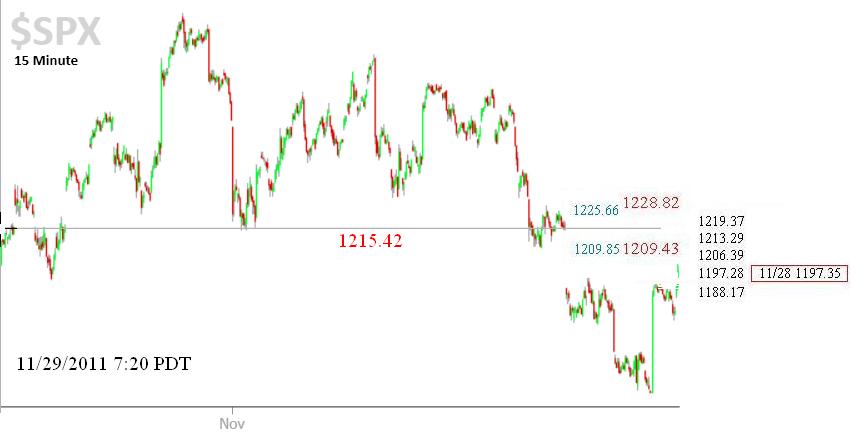
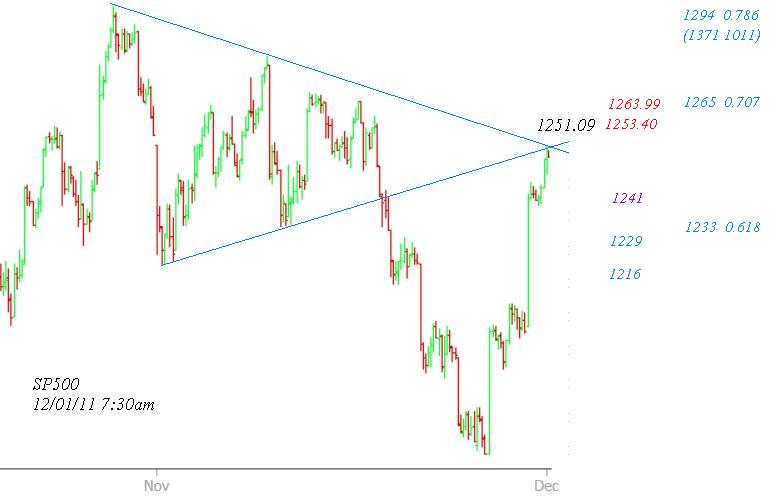
The conflicts on high/low closely synchronized with the breakdown of triangle on 11/16. The low date based on King Wens sequence is still ahead, 12/20 (and 01/04, 01/18, 01/31, not shown in the table, see [1] Time pivots )
Oct 28 2011, 02:01 PM
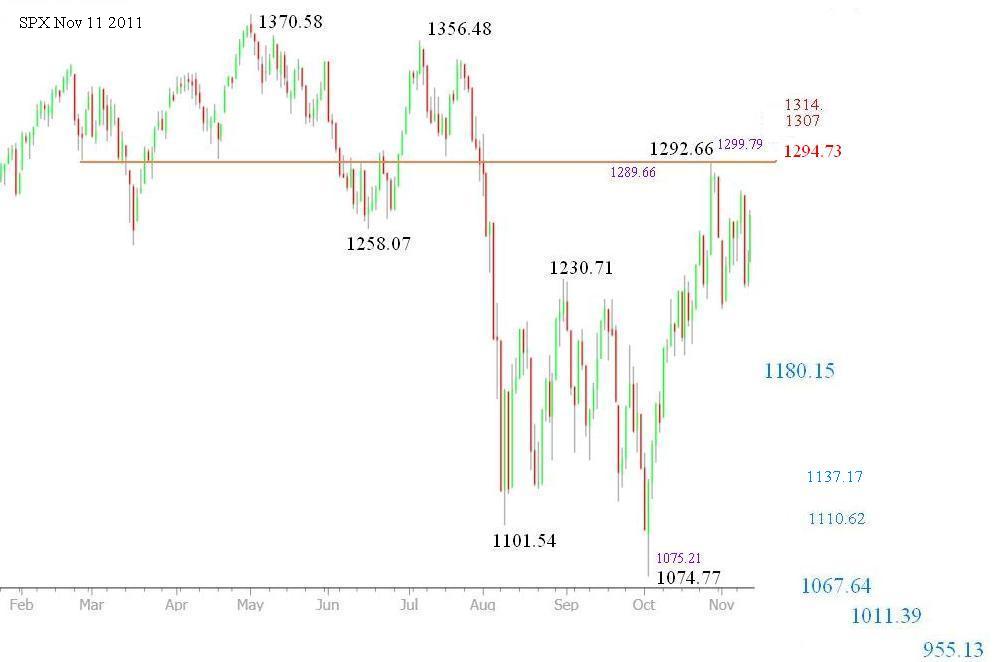
The significance of 1292.66 on 10/27 is not only it is a high ratio Fibonacci point (1292.4 @0.809 1440 vs. 667), after you read
this chart you will know why. ((Fibo-Nacy Posted on 31 July 2011 - 12:01 AM)
Sometimes, the 'textbook' example can serve only as a guide, If you are a large swing trader, where is the Exit point? 1286, 1294 or 1234??, thus the beauty of the market, she teases the speculators to the maximum extent (Stanley posted on Jun 6 2011, 01:04 AM)
Nov 16 2011, 02:00 PM
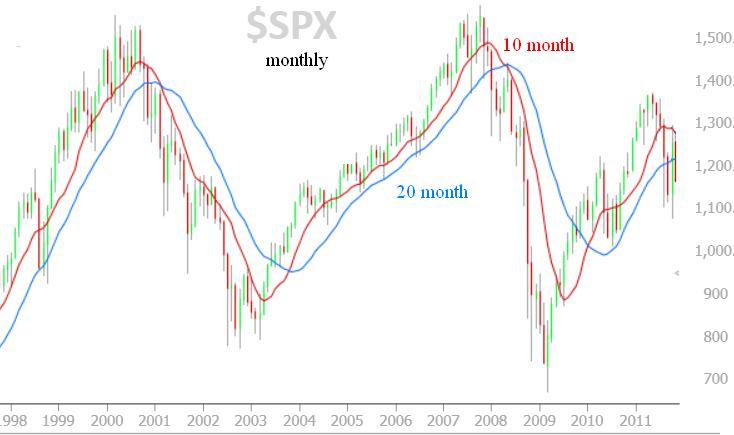
Time flies, when Stanley posted his long term target number 950 that was on April, 2011. So, now, I shall call it the middle term target; As time approaches (March/12 June/12), we can do the fine tuning the number. The key level to watch is 1054 which is the 50% retracement out of 1440 vs. 667. This level was a hot spot when the Octobers plunge cratered at 1074. Based on the already deployed trajectories, somewhere in between 1054 & 1086 will be tested again. The lowest number for the near term target is 955.13 (refer to [2] Index level). so I have maintained the consistency in between the near, middle and long time frames. Important reference numbers are 1294, 1176, 1054 and 944, these number give us the rough hints how the zigzags will traverse among those Fibonacci points.
[1] Time pivots
(a.) Ken Wens sequence see conflicts again
12/20, 01/04,
01/18, 01/31 [Low]
01/17, 01/30, 02/10 [high]
(b.) Bradley Turn dates
11/22-23, 12/28, 1/11, 1/28, 2/16, 2/22,
3/16, ....
full year chart
(c.) 108 trading day cycle
03/12/2012
Something big is going to happen in the stock market next year, I dont want say too much, I can feel it is out there. imho, How to balance amongst the date 12/20, 03/12-16, and 05/26-06/12 is the key.
[2] Index level
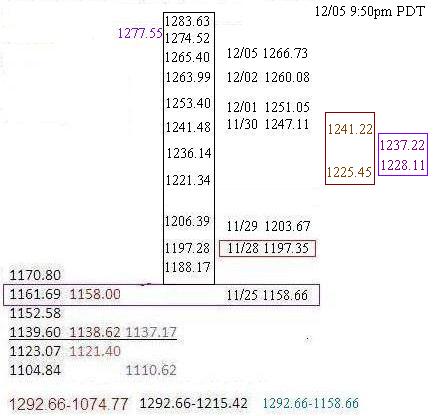
[a.] near term
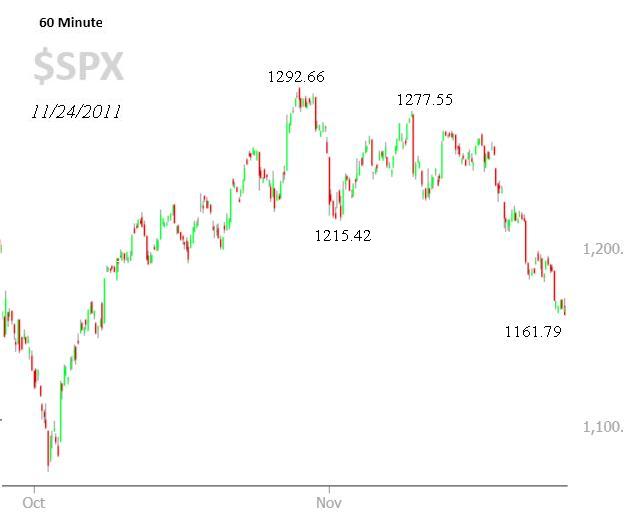
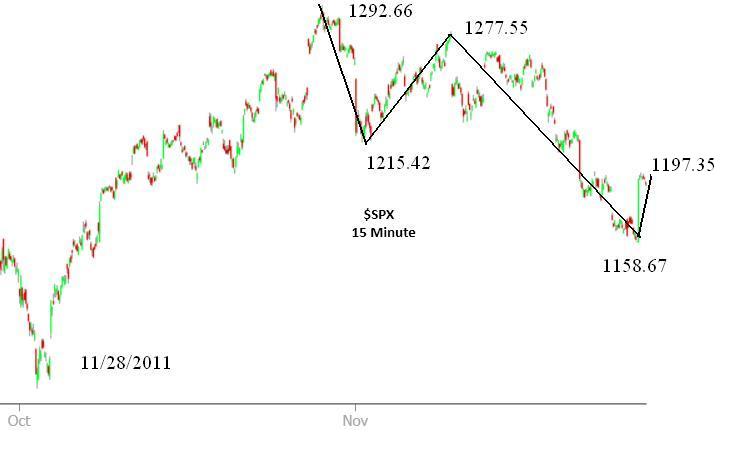
chart
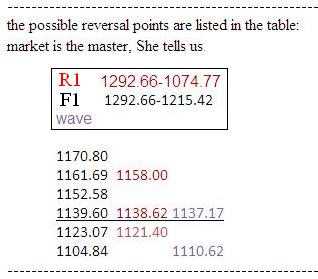
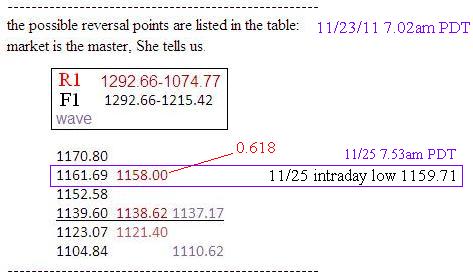
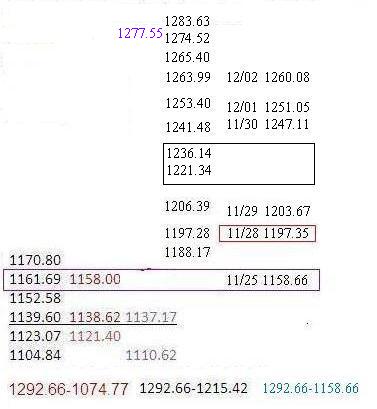
break down table
[b.] middle term 950
Stanley April 24 2011, 02:49 PM
I have a tentative estimate for S&P 500 index low target. It is around 950 (940-972). ......The magnitude and dates should be considered as a guideline and is subjected to change when newer data arrives"
881.38 = [0.236|666.79:1576.09]
1014.14=[0.382|666.79:1576.09]
mean of (881.38 + 1014.14) = 947.76 == 948, round into 950
May 10 2009

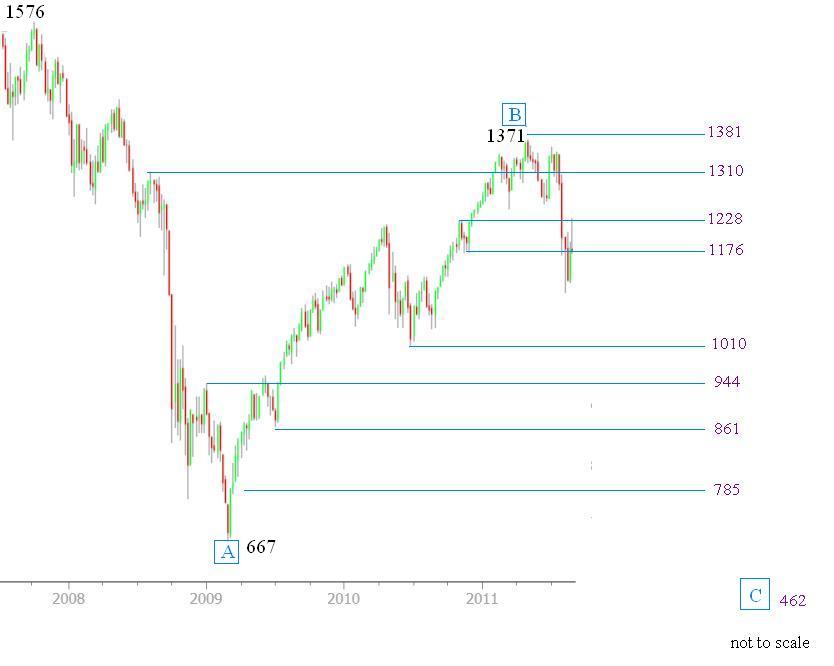
[c.] Long term, the-Bottom 462
chart
original text by Stanley Sep 5 2011, 12:57 AM
[3] Events
2011 Arbic Spring, the squeezed middle
'Squeezed middle' is word of the year
link
Arab Spring -
link
Zodiac 2011 Year of the rabbit
3 February 2011 22 January 2012: Metal Hare
 Hi, Dear Dragon, it's gonna be your turn
Zodiac 2012 Year of the Dragon
Hi, Dear Dragon, it's gonna be your turn
Zodiac 2012 Year of the Dragon
23 January 2012 9 February 2013: Water Dragon,

The Year of the Dragon is again just around the corner and fear and trepidation are once more an issue.
Image/Text source
2012 The year we make real change
An important chapter will be written into the history book.


