Jump to content


Photo

Crafting the rhythms


  • Please log in to reply
140 replies to this topic

#81 fibo-nacy

fibo-nacy

    Member

  • Traders-Talk User
  • 96 posts

Posted 08 December 2011 - 01:16 PM

12/08/2011 9:50am PDT

by Fibo-Nacy

'wave 2' tends to be ‘dragging’ (see discussion), so far it jogs
on top of 11/30’s large run up, in a rather narrow channel (1239.73-1267.06).
At this writing, 12/08 10:12 am PDT, Intraday low is 1237.47.

Retracements status

Posted Image

wave count discussion:

(1) wave labling convention
creditors:
Daneric's Elliott Waves http://danericsellio...s.blogspot.com/
kennytrader http://www.wavaholic...beling-key.html
Posted Image

(2) counting attempt
usually, wave counting speculation shall include both bullish and bearish counts.
for saving posting time, I just post the bearish one.
Wave counting is not an easy task, it is susceptible with embarrassment. shall be guided
within the context of Fibonacci projection.
Posted Image

more complicated cases: http://www.elliottwa...ets/basics3.htm

#82 fibo-nacy

fibo-nacy

    Member

  • Traders-Talk User
  • 96 posts

Posted 09 December 2011 - 02:09 PM

12/09/2011 10:50am PDT

by Fibo-Nacy

intraday
[Dec 5 2011, 12:29 PM] "In case index ascends above 1215.42 decisively, it eliminates the near term bearish call"

short term
range bound [1277.55-1256.79-1215.42] [bullish-neutral-bearish]

middle term
The reversal from 1371 has penetrated below the important Fibonacci retracement zone 1220 to 1229.
This action rules out the possibility the bounce from March/09 low 667 becoming an 5 waves impulse series.
The recent actions is a retest of 1294 that may not extend too much at higher side.
Posted Image

intraday fantasy
Posted Image

#83 Geomean

Geomean

    Member

  • Traders-Talk User
  • 1,177 posts

Posted 10 December 2011 - 11:24 AM

I look forward to some detailed study. Thanks for all of your hard work and willingness to share.

Here's a light hearted application: King Wen sequence animation
Opportunity knocks on your door every day-answer it.

#84 fibo-nacy

fibo-nacy

    Member

  • Traders-Talk User
  • 96 posts

Posted 12 December 2011 - 01:14 PM

12/12/2011 10am PDT

By Fibo-Nacy

draggen33, leverage4, and Geomean
Thank you for your nice reply

-----------------------------------
fibo-nacy Dec 2 2011, 02:39 PM
NDX is is fast approaching to the resistance 2333-2336
The upper rail is 2342-2356. The risk vs. reward is improving on taking the short side
-----------------------------------

NDX marked an intraday high 2343.10 on 12/05, then it reversed.
at this writing, NDX intraday low 2274.15, near 0.5 the retracement
Posted Image

at this writing, SPX intraday low 1227.25 projected 1228.11. watch support 1225-1226, resistance 1231,1237
the table is getting fragmented, needs a cleanup
Posted Image

older table, 12/08

#85 fibo-nacy

fibo-nacy

    Member

  • Traders-Talk User
  • 96 posts

Posted 13 December 2011 - 12:47 PM

12/13/2011 9:40am PDT

By Fibo-Nacy

SPX stalls around 0.618/1241.5 (9.00am PDT)

immediate resistance 1243.37, 1244.39,
immediate support 1241.47 (0.618),

> 1247.15 (intraday bullish)
< 1228.11 (intraday bearish), 1225.66, 1223.68

1241.47 is the 0.618 in between 1158.66 (11/25) and 1292.66 (10/27)
use the retracements/extensions for the rest of the numbers.

This is a range bound action, no clear resolution at this moment.
Posted Image

#86 fibo-nacy

fibo-nacy

    Member

  • Traders-Talk User
  • 96 posts

Posted 14 December 2011 - 10:44 AM

12/14/2011 7:40am PDT

by Fibo-Nacy

so far (7:40am PDT) the intraday low is 1213.21

wave en route 1292.66-1215.42, root 1267.06.
0.5 out of (1158.66,1267.06) is 1212.86

Posted Image

at critical point
intraday [1277.55-1256.79-1215.42] [bullish-neutral-bearish]
Posted Image

#87 fibo-nacy

fibo-nacy

    Member

  • Traders-Talk User
  • 96 posts

Posted 15 December 2011 - 11:28 AM

12/15/2011 8:20am PDT

By Fibo-Nacy

- it is getting closer to an intraday reversal action in the next few days,
- this is in-progress speculation, no sure certainty.
- day low on 11/01 1215.42 is an important gauge
- chart gives the overall picture
- table in the chart to fill in the detail breakouts below 1180.15 (it was proved as an important pivot.)
- bottom table gives speculation, Fibonacci is not tough to calculate, it is tough to find reference points
- so far, index is blocked by resistance 1225.65. The immediate support is 1206.35.
- at this writing, intraday high is 1225.60

Posted Image

Posted Image

#88 fibo-nacy

fibo-nacy

    Member

  • Traders-Talk User
  • 96 posts

Posted 16 December 2011 - 10:45 AM

12/16/2011 7:40am PDT

By Fibo-Nacy

so far intraday high is 1231.04 (7:32am PDT) (0.382 1231.46)

Posted Image

archive - 12/15/2011
- it is getting closer to an intraday reversal action in the next few days,
- this is in-progress speculation, no sure certainty.
- day low on 11/01 1215.42 is an important gauge (index closing number was 1215.75 on 12/15)

history:
1,257.64 12/31, 2010 close
1,257.62 01/03, 2011 open
1,246.91 12/01, 2011 close

#89 fibo-nacy

fibo-nacy

    Member

  • Traders-Talk User
  • 96 posts

Posted 16 December 2011 - 10:58 AM

12/16/2011 7:40am PDT

By Fibo-Nacy

so far intraday high is 1231.04 (7:32am PDT) (0.382 1231.46)

Posted Image

archive - 12/15/2011
- it is getting closer to an intraday reversal action in the next few days,
- this is in-progress speculation, no sure certainty.
- day low on 11/01 1215.42 is an important gauge (index closing number was 1215.75 on 12/15)

history:
1,257.64 12/31, 2010 close
1,257.62 01/03, 2011 open
1,246.91 12/01, 2011 close

#90 fibo-nacy

fibo-nacy

    Member

  • Traders-Talk User
  • 96 posts

Posted 19 December 2011 - 12:00 AM

12/18/2011 9.00pm PST

By Fibo-Nacy

In summary

(a.) Regardless of whether the SPX will reach 1320 or not, Index is much closer to the upper rail with a few hundred points down side possibility. A good opportunity is forming for the large swing traders.

(b.) I use the gauge 1277.55 to probe the early stage bullish scenario; In case SPX moves above 1320, all bearish bets are off, at least temporarily. has to wait the index reverse below 1294 again. Right now the index is about 55 points below 1277.55, not a big threat for the bearish scenario.

Time speculation

(a.) Ken Wen’s sequence see conflicts again

12/20, 01/04, 01/18, 01/31 [Low]
01/17, 01/30, 02/10 [high]

(b.) Bradley Turn dates
12/28 [important], 1/11, 1/28, 2/16, 2/22, 3/16 [important]

(c.) 108 trading day cycle 03/12/12 +/-.

Retracements/Wave extensions

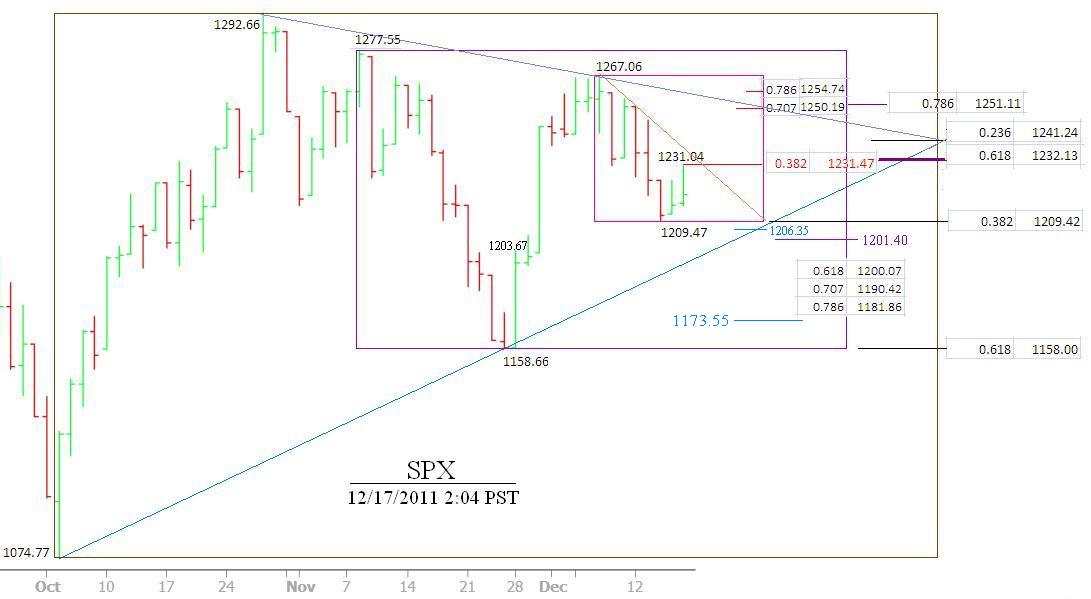
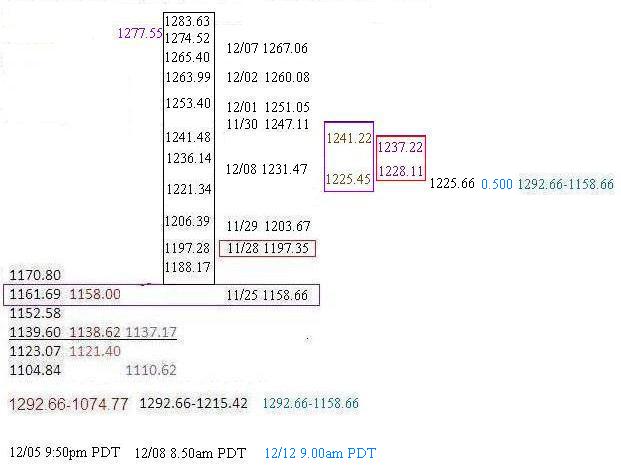
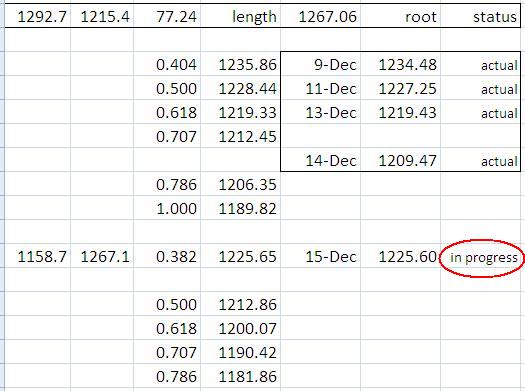
Here is the chart & table that illustrates the index activities.
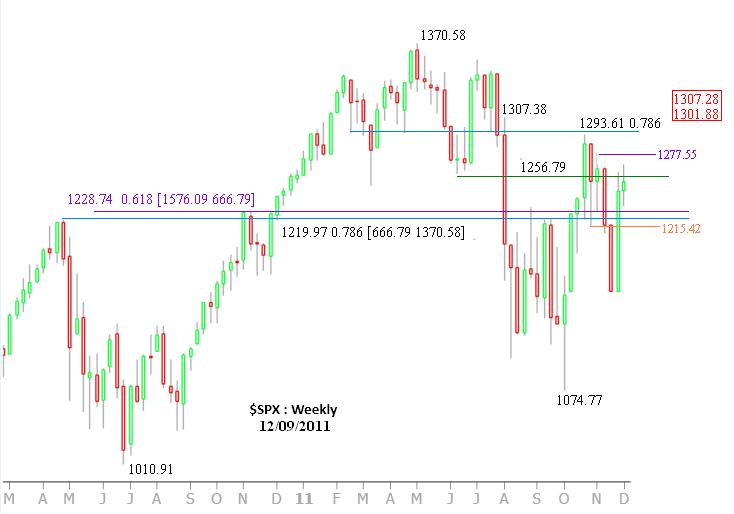
(1) The outer layer is 1292.66-1074.77. Index marked two important terminal points, 1158.66 and 1209.47. On top of the major Fibonacci point 1293.61 is the resistance 1302, 1307, 1314,and 1320. [not shown in the chart]
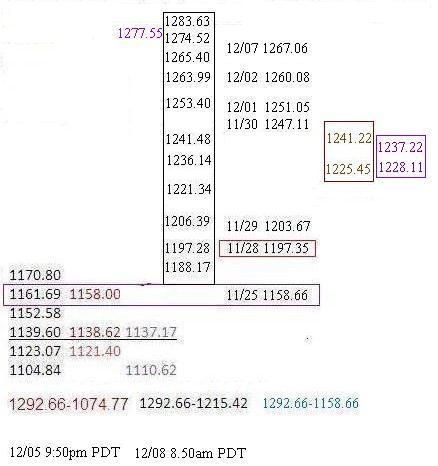
(2) The inner layer is from 1258.66 to 1277.55, quite a few good Fibonacci hits in between.
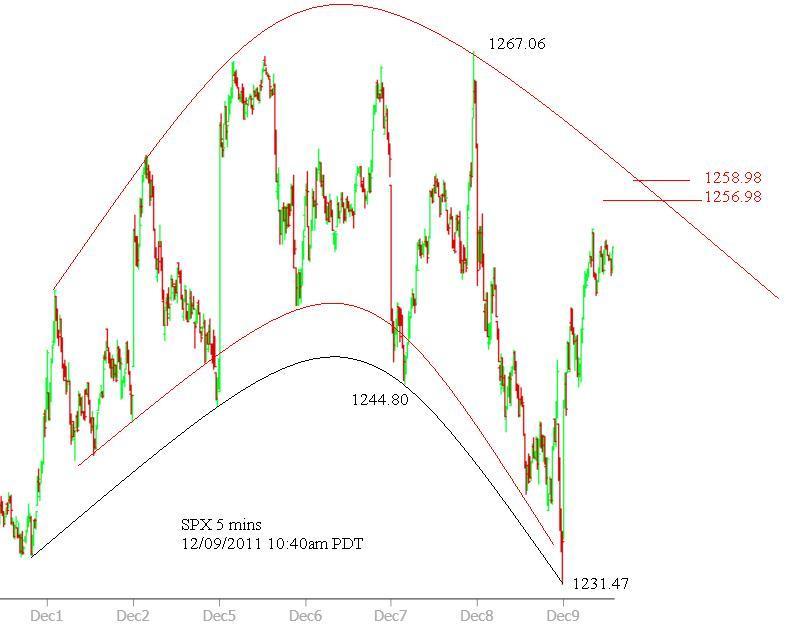
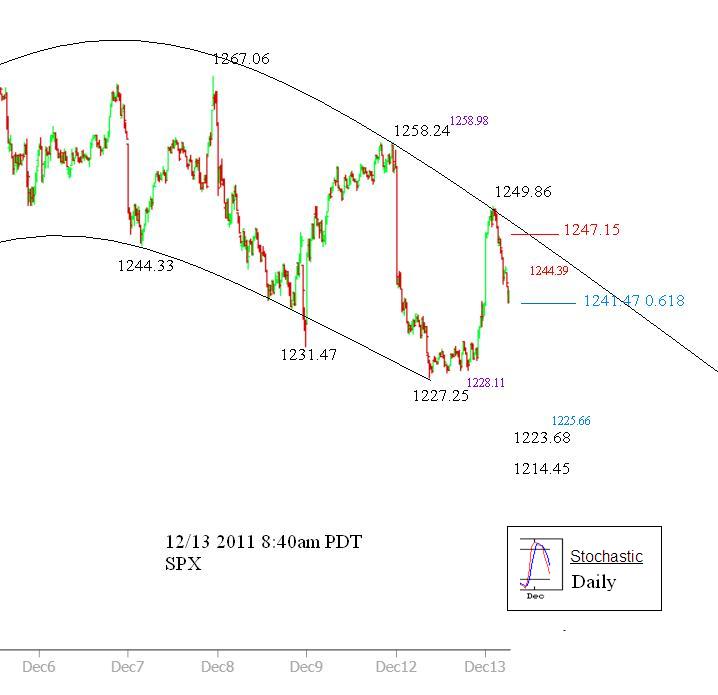
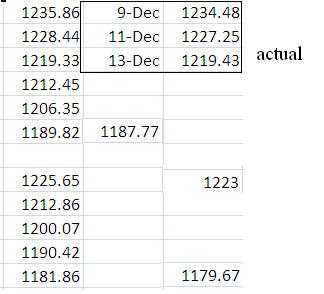
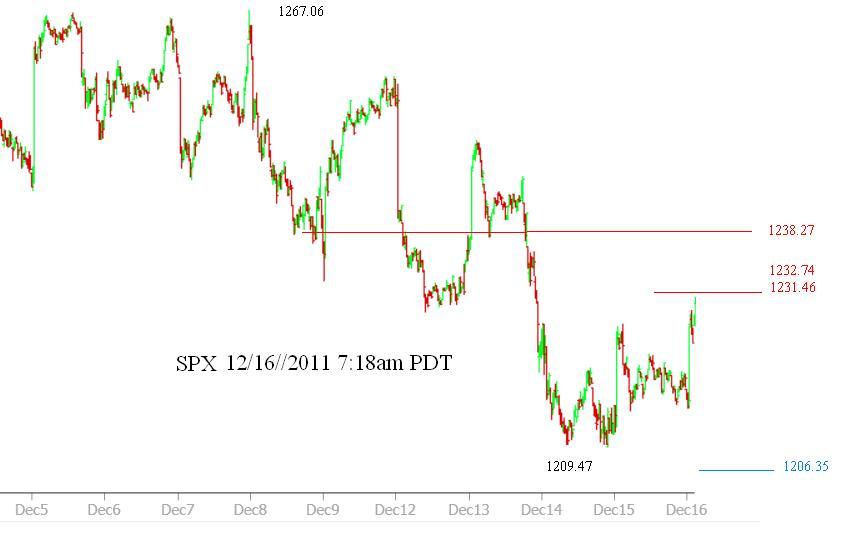
(3) The local layer is from 1209.47 to 1267.06, Last Friday (12/16) intraday has a good hit on 0.382/1231.04 (actual 1231.47).
(4) Due to the complexity, I skip the numbers based on wave extensions. Too much information hinders the thought process.

Posted Image

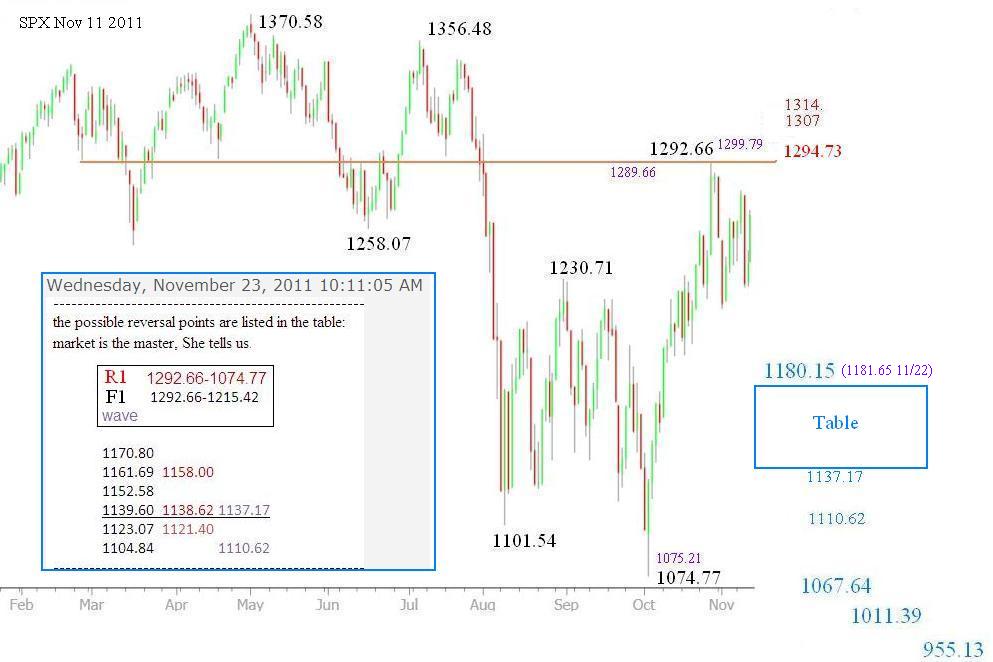
I nailed the October low 1075 correctly in this chart 08/10, the calculation is 1356.48 – 2.5 * (1370.58-1258.07) = 1075.21 (actual 1074.77). my 'new' speculation was posted on 11/11. I will put a breakdown table for the numbers in between 1105-1011, let’s go step by step.
Posted Image

Older references

Stanley Oct 10 2011, 08:59 AM
Zigzags zone has moved from [1228-1310-1381] down to [1011-1176-1228]. it is in the process of testing the upper rail 1228. strong overhead resistance lies in between 1258-1268; it will take time to wash out 1011-1102, once it gets done, the next zone would be 861-944-1011.

Fibo-Nacy Nov 25 2011, 11:38 AM
Crafting the rhythms series II, November 25, 2011
Title: Connecting flight to 2012

Fibo-Nacy Dec 8 2011, 10:16 AM
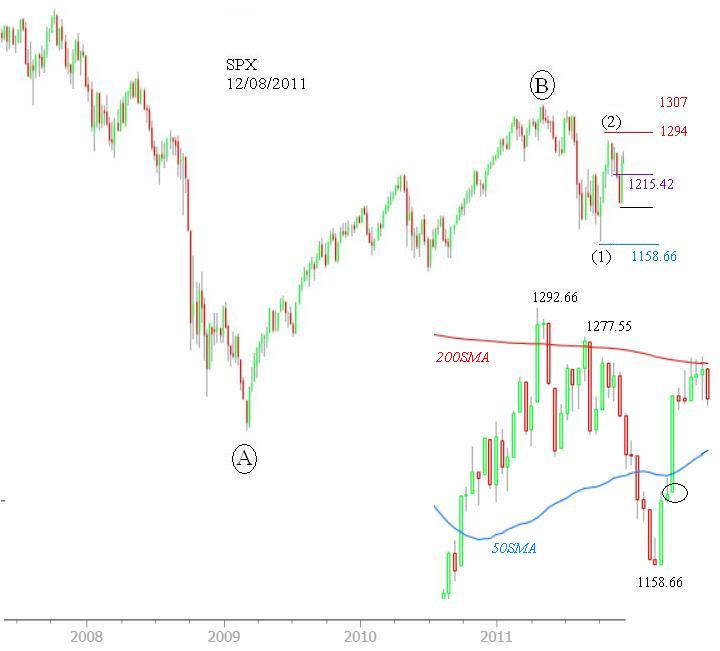
This is the bearish case wave chart

Fibo-Nacy Dec 9 2011, 11:09 AM
range bound chart