take a long Haitus, may be come back in June.
Here is a pretty good coverage about S&P, oil, and gold
Market Turning Points
By: Andre Gratian | Sun, Mar 27, 2011
http://www.safehaven...-turning-points
Based upon the latest data, two key notes:
(a.) The wave since March 09 is very clearly running on its own, not a sub-wave from 2007's High. [2]
(b.) In the last few months, I mentioned couple times the bullish gauge is 1265. This is an important pivot to sense the strength of the index. Index seems will rest the nearby FIB zone. The Fibonacci retracement is the tenet for E-wave (Note), key FIB points worth of attention; Coincidently, 1265 is the 0.236 out of a local frame 1010.91 (07/01/2010) and 1344.07 (02/18/2011).
Note:
Fibonacci relationships http://en.wikipedia...._wave_principle
R. N. Elliott's analysis of the mathematical properties of waves and patterns eventually led him to conclude that "The Fibonacci Summation Series is the basis of The Wave Principle.".
Crafting the rhythms series II 03/29/11
http://www.traders-t...?...st&p=569917
".... market may just swing up/down with the center line at 1310; The unrealized high target are 1358, 1381, the unrealized low target are 1240-1229, 1214-1222"
Two cursory type E-wave posts I did in the last two years
[1] Apr 29 2009, 03:15 PM
http://indexcalls.co...o...st&p=484712
by surmounting 881, the wave hierarchy changes. The rally wave since March 6th (2009) becomes a major wave. Therefore, a primary wave B (Up, counter-trend) has commenced. It is at the same level as the wave from Oct/07 to March/09 (Primary A, Down);
[2] Apr 13 2010, 09:58 AM
http://www.traders-t...?...st&p=516726
When index exceeds 1256.98 the wave status since March 09 may separate from the prior one (1576-->667) and become an individual segment. When the wave is becoming a separate segment, it is capable of reaching 1300 level. The half power point 0.707 from 667 to 1576 is 1310, very close to the High 1313.15 marked on 08/11/08.

Crafting the rhythms
Started by
stanley
, Apr 13 2010 12:58 PM
140 replies to this topic
#52

stanley
-
- Traders-Talk User
- 167 posts
Member
Posted 24 April 2011 - 12:49 PM
Crafting the rhythms 04/23/11
Painstakingly Waiting
March 26, 2011 by tony caldaro
The bull market of March 2009 is about to officially enter its third year on Friday (03/25/11) and there are still some calling it a bear market rally. From an OEW perspective, there has not been one bear market rally lasting more than two years during the entire 125 year documented history of the US stock market.
read more: weekend update March 26, 2011 by tony caldaro
[1] Review
(a.) Painstakingly Waiting
Mar 29 2011: Market is waiting a few key questions to be answered: (1) debt ceiling, (2) QE3, (3) The economy strength status.. etc. Before clear answers come out, market may just swing up/down with the center line at 1310; The unrealized high target are 1358, 1381, the unrealized low target are 1240-1229, 1214-1222
(b.) Bullish gauge is 1265
Dec 7 2010: My works suggest that the SPX 1265 (intraday low 03/17/08) is a critical pivot. As long as the index can surmount this pivot, next target is 1310 or even higher
Dec 26 2010: Bullish gauge is 1265
Mar 13 2011: Use the frame Low 1010.91 (07/01/2010) : High 1344.07 (02/18/2011), 0.236 @1265.44
(c.) February high could be a secondary high
Mar 13 2011: The time length from 07/01/2010 (1010.91) to 02/18/2011 (1344.07) are 157 trading days, 0.5 of 100 * PI. From this long multiple PI table, February high didnt synchronize with the prime time mark, could be a secondary event, a classical harmonic behavior.
(d.) King Wens sequence prediction
High 02/18/11, right on; Low 03/16/11, off one day.
(e.) The wave structure since Marchs low (09) looks bullish
Sep 4, Sep 19 2010
The wave structure since Marchs low (09) looks bullish.
So far the pullback from 1219 (04/26/10) is considered a correction of a longer term bullish wave structure, with an unrealized middle term target 944-948.
Be aware the Bradley Siderograph unique signature in 2011, one year before the long awaited storm zone 2012-2014

Viewers may go over the Bradley Siderograph for the next 8 years and find out why 2011s is unique.
2010
2011 2012 2013 2014
2015 2016 2017 2018
Dec 26 2010:
Trend is up until it is not
"It ain't over 'til the fat lady sings" ( http://en.wikipedia.org/wiki/It_ain't_..._fat_lady_sings )
Patience is a virtue
[2] Fundamentals
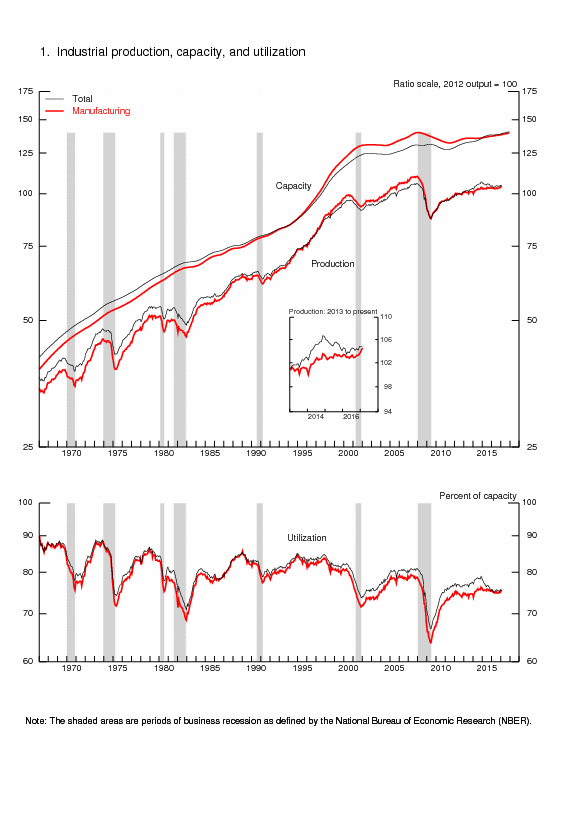
(a.) Industrial Production and Capacity Utilization
The correlation coefficient is 0.71391 in between S&P500 & U.S. Industrial Production Index which can be considered highly correlated.
details in post #46 02/16/11
Industrial Production and Capacity Utilization
Fed Release Date: April 15, 2011
link to Industrial Production and Capacity Utilization - G.17
Industrial production increased 0.8 percent in March and rose at an annual rate of 6.0 percent for the first quarter as a whole. Manufacturing output advanced 0.7 percent in March, its fourth consecutive month of strong expansion; factory production climbed at an annual rate of 9.1 percent in the first quarter.
chart: Industrial Production, Capacity, and Capacity Utilization
(b.) Feds balance sheet
Talking about Feds balance sheet, John Mauldin Outside the Box has an excellent commentary released on 04/18/2011.
The Feds balance sheet staus is like a weathervane, it is telling us that the strong wind shear is looming.
Here is the link:
Charles Plosser and the 50% Contraction in the Feds Balance Sheet
By John Mauldin - April 18, 2011
read full commentary in Outside the Box April 18, 2011 or Charles Plosser and the 50% Contraction in the Feds Balance Sheet
[3] Fibonacci retracements
(a.) Zigzags cursory view
Jan 2 2011
The center line is 1310 (1309), upper rail 1381, and lower rail 1229(1228).

[b.] Fibonacci cluster
Index is clearly en route 1381:1173, with supports at 1320, 1302, 1277 & 1252. The recent combating zone is 1294-1336. 1381 is an important pivot to see 1402.
Feb 2 2011
[c.] broad view
wave target 1394,1412, Fibonacci retracements 1410 (0.707),1435,1468 (frame 1576:1011)
linear scale

logarithmic scale

(d) middle term view


[4] 105 trading day cycle
Mar 13 2011
There is a possible time window in April/May juncture, a 2 * 104.7 trading day cycle from 07/01/10 Low (100*PI/3 = 104.7) may recur; There are three timing stamps in the near to middle term time frame, Feb/March, April/May, and June/July. It is hard to sort out the relationship.
April 20 2011
The 105-108 trading day cycle (100 * PI)/3 is not periodical. When it is on recurring, it may show 2 cycles with total length 210-220.
for example:
Jan 30 2010
The one roots on 07/01/2010 is in particularly weird, suppose to be a low on coming 04/28 +/- but it apparently has been lifting by a much bullish underlying sentiment, a peak might be in June. This is an unsettle market, things can go wild. Look at the weekly $NYAD, no signs of weakness.
There are technicians calling a high in this coming June. The possible dates are speculated in the next two section, the King Wen sequence and Long multiple PI dates.

[5] King Wen sequence
King Wen sequence prediction has at least two obvious limitations: (i) It requires some other TA indicators to nail the most likely date in a set of sequences. There are some techniques attempts on determining the next route, far beyond my scope. (ii) It cannot hunt down a harmonic cycle that is shorter than 54 trading days. [to be elaborated]


background info:
[i] The 108 in King Wen's Sequence By J.M. Berger
http://iching.egople.../hidden108.html
[ii] The King Wen sequence (文王卦序, King Wen hexagrams divination sequence)
http://en.wikipedia....ng_Wen_sequence
[iii] King Wen: Change And Symmetry
http://iching.egople...w-symmetry.html
[6] Long multiple PI dates
Feb 11 2011
SPX marked a major Trough on March 6, 09, a secondary high on April 26, 10. Unfortunately, This Long multiple PI projection does not tell the set date will be a major or secondary event. The Inversion is another headache, we will need different TA indicators to judge.
April 22 2011
In the Crafting the rhythms series, I have discussed the Long multiple PI dates frequently. For the first time viewers, here is a quick summary:
Monumental time marks
* Black Monday, October 19, 1987
* Millennium Internet peak (SPX), March 24, 2000
* First 4 year cycle low since millennium, October 10, 2002
* The apex of Great Reflation, October 11, 2007
* The first Trough since the Great Reflation, March 6, 2009
By converting the trading days into PI based multiples, a set of meaningful numbers pops off
For example: there are 3144 trading days from 10/19/1987 to 03/24/2000. For verification, You may use the Historical Prices and download the data to your spreadsheet.
Here is the latest updated table

[7] Long term projection
I have a tentative estimate for S&P 500 index low target. It is around 950 (940-972). refer to (i),(ii)
You may review the chart in section [3] Fibonacci retracements, (a.) Zigzags cursory view. see if you can grip the same Perception; The magnitude and dates should be considered as a guideline and is subjected to change when newer data arrives.
(i)
881.38 = [0.236|666.79:1576.09]
1014.14=[0.382|666.79:1576.09]
mean of (881.38 + 1014.14) = 947.76 == 948, round into 950
There is an observed Time vs. magnitude ratio 0.3-0.303 (1.5/3) which is very close to the mean (0.382+0.236)=0.306
May 10 2009

(ii) assume index will reach peak in between 1381-1410-1468, and deploy only a 0.618 retracement without taking out the low 667. We can come out 940-950-972.
Painstakingly Waiting
March 26, 2011 by tony caldaro
The bull market of March 2009 is about to officially enter its third year on Friday (03/25/11) and there are still some calling it a bear market rally. From an OEW perspective, there has not been one bear market rally lasting more than two years during the entire 125 year documented history of the US stock market.
read more: weekend update March 26, 2011 by tony caldaro
[1] Review
(a.) Painstakingly Waiting
Mar 29 2011: Market is waiting a few key questions to be answered: (1) debt ceiling, (2) QE3, (3) The economy strength status.. etc. Before clear answers come out, market may just swing up/down with the center line at 1310; The unrealized high target are 1358, 1381, the unrealized low target are 1240-1229, 1214-1222
(b.) Bullish gauge is 1265
Dec 7 2010: My works suggest that the SPX 1265 (intraday low 03/17/08) is a critical pivot. As long as the index can surmount this pivot, next target is 1310 or even higher
Dec 26 2010: Bullish gauge is 1265
Mar 13 2011: Use the frame Low 1010.91 (07/01/2010) : High 1344.07 (02/18/2011), 0.236 @1265.44
(c.) February high could be a secondary high
Mar 13 2011: The time length from 07/01/2010 (1010.91) to 02/18/2011 (1344.07) are 157 trading days, 0.5 of 100 * PI. From this long multiple PI table, February high didnt synchronize with the prime time mark, could be a secondary event, a classical harmonic behavior.
(d.) King Wens sequence prediction
High 02/18/11, right on; Low 03/16/11, off one day.
(e.) The wave structure since Marchs low (09) looks bullish
Sep 4, Sep 19 2010
The wave structure since Marchs low (09) looks bullish.
So far the pullback from 1219 (04/26/10) is considered a correction of a longer term bullish wave structure, with an unrealized middle term target 944-948.
Be aware the Bradley Siderograph unique signature in 2011, one year before the long awaited storm zone 2012-2014
Viewers may go over the Bradley Siderograph for the next 8 years and find out why 2011s is unique.
2010
2011 2012 2013 2014
2015 2016 2017 2018
Dec 26 2010:
Trend is up until it is not
"It ain't over 'til the fat lady sings" ( http://en.wikipedia.org/wiki/It_ain't_..._fat_lady_sings )
Patience is a virtue
[2] Fundamentals
(a.) Industrial Production and Capacity Utilization
The correlation coefficient is 0.71391 in between S&P500 & U.S. Industrial Production Index which can be considered highly correlated.
details in post #46 02/16/11
Industrial Production and Capacity Utilization
Fed Release Date: April 15, 2011
link to Industrial Production and Capacity Utilization - G.17
Industrial production increased 0.8 percent in March and rose at an annual rate of 6.0 percent for the first quarter as a whole. Manufacturing output advanced 0.7 percent in March, its fourth consecutive month of strong expansion; factory production climbed at an annual rate of 9.1 percent in the first quarter.
chart: Industrial Production, Capacity, and Capacity Utilization
(b.) Feds balance sheet
Talking about Feds balance sheet, John Mauldin Outside the Box has an excellent commentary released on 04/18/2011.
The Feds balance sheet staus is like a weathervane, it is telling us that the strong wind shear is looming.
Here is the link:
Charles Plosser and the 50% Contraction in the Feds Balance Sheet
By John Mauldin - April 18, 2011
read full commentary in Outside the Box April 18, 2011 or Charles Plosser and the 50% Contraction in the Feds Balance Sheet
[3] Fibonacci retracements
(a.) Zigzags cursory view
Jan 2 2011
The center line is 1310 (1309), upper rail 1381, and lower rail 1229(1228).
[b.] Fibonacci cluster
Index is clearly en route 1381:1173, with supports at 1320, 1302, 1277 & 1252. The recent combating zone is 1294-1336. 1381 is an important pivot to see 1402.
Feb 2 2011
[c.] broad view
wave target 1394,1412, Fibonacci retracements 1410 (0.707),1435,1468 (frame 1576:1011)
linear scale
logarithmic scale
(d) middle term view
[4] 105 trading day cycle
Mar 13 2011
There is a possible time window in April/May juncture, a 2 * 104.7 trading day cycle from 07/01/10 Low (100*PI/3 = 104.7) may recur; There are three timing stamps in the near to middle term time frame, Feb/March, April/May, and June/July. It is hard to sort out the relationship.
April 20 2011
The 105-108 trading day cycle (100 * PI)/3 is not periodical. When it is on recurring, it may show 2 cycles with total length 210-220.
for example:
Jan 30 2010
The one roots on 07/01/2010 is in particularly weird, suppose to be a low on coming 04/28 +/- but it apparently has been lifting by a much bullish underlying sentiment, a peak might be in June. This is an unsettle market, things can go wild. Look at the weekly $NYAD, no signs of weakness.
There are technicians calling a high in this coming June. The possible dates are speculated in the next two section, the King Wen sequence and Long multiple PI dates.
[5] King Wen sequence
King Wen sequence prediction has at least two obvious limitations: (i) It requires some other TA indicators to nail the most likely date in a set of sequences. There are some techniques attempts on determining the next route, far beyond my scope. (ii) It cannot hunt down a harmonic cycle that is shorter than 54 trading days. [to be elaborated]
background info:
[i] The 108 in King Wen's Sequence By J.M. Berger
http://iching.egople.../hidden108.html
[ii] The King Wen sequence (文王卦序, King Wen hexagrams divination sequence)
http://en.wikipedia....ng_Wen_sequence
[iii] King Wen: Change And Symmetry
http://iching.egople...w-symmetry.html
[6] Long multiple PI dates
Feb 11 2011
SPX marked a major Trough on March 6, 09, a secondary high on April 26, 10. Unfortunately, This Long multiple PI projection does not tell the set date will be a major or secondary event. The Inversion is another headache, we will need different TA indicators to judge.
April 22 2011
In the Crafting the rhythms series, I have discussed the Long multiple PI dates frequently. For the first time viewers, here is a quick summary:
Monumental time marks
* Black Monday, October 19, 1987
* Millennium Internet peak (SPX), March 24, 2000
* First 4 year cycle low since millennium, October 10, 2002
* The apex of Great Reflation, October 11, 2007
* The first Trough since the Great Reflation, March 6, 2009
By converting the trading days into PI based multiples, a set of meaningful numbers pops off
For example: there are 3144 trading days from 10/19/1987 to 03/24/2000. For verification, You may use the Historical Prices and download the data to your spreadsheet.
Here is the latest updated table
[7] Long term projection
I have a tentative estimate for S&P 500 index low target. It is around 950 (940-972). refer to (i),(ii)
You may review the chart in section [3] Fibonacci retracements, (a.) Zigzags cursory view. see if you can grip the same Perception; The magnitude and dates should be considered as a guideline and is subjected to change when newer data arrives.
(i)
881.38 = [0.236|666.79:1576.09]
1014.14=[0.382|666.79:1576.09]
mean of (881.38 + 1014.14) = 947.76 == 948, round into 950
There is an observed Time vs. magnitude ratio 0.3-0.303 (1.5/3) which is very close to the mean (0.382+0.236)=0.306
May 10 2009
(ii) assume index will reach peak in between 1381-1410-1468, and deploy only a 0.618 retracement without taking out the low 667. We can come out 940-950-972.
#53
stanley
-
- Traders-Talk User
- 167 posts
Member
Posted 06 June 2011 - 12:04 AM
Crafting the rhythms series II 06/05/11
Turbulence before the Final Period
In essence:
Index is seemingly weakening but it is still not far from the unrealized high target.
Even though it dwells into the turbulence zone, perhaps, there is a final stretch before the index falls into the abyss.
review & update:
------------------------------
Mar 29 2011, 12:52 PM
Market is waiting a few key questions to be answered: (1) debt ceiling, (2) QE3, (3) The economy strength status.. etc. ,. Before clear answers come out, market may just swing up/down with the center line at 1310; The unrealized high targets are 1358, 1381, the unrealized low targets are 1240-1229, 1214-1222
Apr 24 2011, 12:49 PM
Index is clearly en route 1381:1173, with supports at 1320, 1302, 1277 & 1252. The recent combating zone is 1294-1336. 1381 is an important pivot to see 1402.
------------------------------
Index poked into the red box in this chart on 04/28, one trading day early than projected date. it marked an intraday high 1370.58 on 05/02. The peak is only 0.02 points shy from the historical point (08/16/2007) showed in this chart.
Now, one of the high targets 1358 has been realized, the other target 1381 remains unrealized. The noteworthy point is the mean value 1309.8 in between the recent low 1249.05 (03/16/11) and recent high 1370.58 (05/02/11), it overlaps with the aforementioned swing center line 1310. Therefore, This chart will continuously provide valuable broad view.
The near term outlook remains the same. the combating zone is 1294-1336. Supports below 1294 are: 1278-1270, 1252-1244, 1240-1229, 1222-1214; Resistance above 1336 are 1346, 1358, 1374.
Sometimes, the 'textbook' example can only serve as a guide, If you are a large swing trader, where is the Exit point? 1286, 1294 or 1234??, thus the beauty of the market, she teases the speculators to the maximum extent . So far, the 50 SMA is on top of 200 SMA, and price is on top of 1278, the overall structure is still bullish.

In 2001, a big decline came after two flat expansions , The recent softness is deploying the very similar rhythms. Will the same outcome recur?

I divide the trajectories since March low in 2009 till now according to the rhythms, not E-wave count, into a few zones. As long as the dip does not violate 1220. the bullish stance will continue. this view does not take fundamental factors into account. Things could begin the spiral down in the next few months ...

Timing window
------------------------------
Apr 24 2011, 12:49 PM
King Wen sequence prediction has at least two obvious limitations: (i) It requires some other TA indicators to nail the most likely date in a set of sequences. There are some techniques attempts on determining the next route, far beyond my scope. (ii) It cannot hunt down a harmonic cycle that is shorter than 54 trading days. [to be elaborated]
------------------------------
I left a footnote in the prior post, to be elaborated. Yes, this is the first time I see so many overlapes in High/Low dates' projection; In addition, the high 1370.58 observed on May 02 is within the time window 05/06 (the first 'possible' date in the following table.). If it is "that day", it would be the shortest time span I have tracked.
The actions since May 02 is very similar to the time period in between 04/26/10 (High 1219.80) and 07/01/10 (Low 1010.91), there were short cycle harmonics that is shorter than King Wen sequence can resolve. Put together, the conflicts in High/Low suggests that a major consolidation both in time & magnitude has commenced.

108 trading day cycle realigned on 05/02 is due on 10/05
The Fibonacci time zone ratio 1.618 is due on 06/10, 1.786 is due on 09/27
The Long PI multiple is due on 07/05 complete schedule
Astro
As usual, This is the entertainment department.
Lets begin with two quotes:
------------------------------
MMA Comments for the Week Beginning June 6, 2011
Written by Raymond Merriman
link
...... Jupiter in Aries. Along with Uranus in Aries, this has been the cosmic engine that has propelled this bull market since summer 2010. Now half of that wild and speculative combo Jupiter leaves the wild and speculative sign of Aries.
..... Welcome to the post Asset Inflation Express era. ........ as we begin to encounter the dynamics of the Uranus in its waxing square to Pluto. Officially that begins in 2012 and lasts through 2015.
MMA Comments for the Week Beginning May 30
Written by Raymond Merriman
link
..... Jupiter is leaving that sector of the sky June 4. It ingresses into Taurus. ...... ... and then it returns partially to this sector of the heavens between October 2011 and March 2012, due to Jupiters retrograde motion. The point is that we are at a critical point in the orbit of Jupiter around the Sun. A long-term crest in the stock market is due, and a multi-year bear market is scheduled to commence once this Asset Inflation Express runs out of gas er, cosmic energy
------------------------------
Path of the Jupiter (partial map, with annotation)

http://www.nakedeyep...tm#conjunctions
http://www.cafeastro...etrogrades.html
First of all, There is some indiscernible part in Merriman's original text is considered "as is" (highlighted by blue color). While the market is entering the Turbulence, Jupiters retrograde motion (highlighted by purple color) gives a possibility that , perhaps, there is a final stretch before it head into the abyss.
------------------------------
Dec 26 2010, 05:04 PM
Turbulence before the Final Period
In essence:
Index is seemingly weakening but it is still not far from the unrealized high target.
Even though it dwells into the turbulence zone, perhaps, there is a final stretch before the index falls into the abyss.
review & update:
------------------------------
Mar 29 2011, 12:52 PM
Market is waiting a few key questions to be answered: (1) debt ceiling, (2) QE3, (3) The economy strength status.. etc. ,. Before clear answers come out, market may just swing up/down with the center line at 1310; The unrealized high targets are 1358, 1381, the unrealized low targets are 1240-1229, 1214-1222
Apr 24 2011, 12:49 PM
Index is clearly en route 1381:1173, with supports at 1320, 1302, 1277 & 1252. The recent combating zone is 1294-1336. 1381 is an important pivot to see 1402.
------------------------------
Index poked into the red box in this chart on 04/28, one trading day early than projected date. it marked an intraday high 1370.58 on 05/02. The peak is only 0.02 points shy from the historical point (08/16/2007) showed in this chart.
Now, one of the high targets 1358 has been realized, the other target 1381 remains unrealized. The noteworthy point is the mean value 1309.8 in between the recent low 1249.05 (03/16/11) and recent high 1370.58 (05/02/11), it overlaps with the aforementioned swing center line 1310. Therefore, This chart will continuously provide valuable broad view.
The near term outlook remains the same. the combating zone is 1294-1336. Supports below 1294 are: 1278-1270, 1252-1244, 1240-1229, 1222-1214; Resistance above 1336 are 1346, 1358, 1374.
Sometimes, the 'textbook' example can only serve as a guide, If you are a large swing trader, where is the Exit point? 1286, 1294 or 1234??, thus the beauty of the market, she teases the speculators to the maximum extent . So far, the 50 SMA is on top of 200 SMA, and price is on top of 1278, the overall structure is still bullish.
In 2001, a big decline came after two flat expansions , The recent softness is deploying the very similar rhythms. Will the same outcome recur?
I divide the trajectories since March low in 2009 till now according to the rhythms, not E-wave count, into a few zones. As long as the dip does not violate 1220. the bullish stance will continue. this view does not take fundamental factors into account. Things could begin the spiral down in the next few months ...
Timing window
------------------------------
Apr 24 2011, 12:49 PM
King Wen sequence prediction has at least two obvious limitations: (i) It requires some other TA indicators to nail the most likely date in a set of sequences. There are some techniques attempts on determining the next route, far beyond my scope. (ii) It cannot hunt down a harmonic cycle that is shorter than 54 trading days. [to be elaborated]
------------------------------
I left a footnote in the prior post, to be elaborated. Yes, this is the first time I see so many overlapes in High/Low dates' projection; In addition, the high 1370.58 observed on May 02 is within the time window 05/06 (the first 'possible' date in the following table.). If it is "that day", it would be the shortest time span I have tracked.
The actions since May 02 is very similar to the time period in between 04/26/10 (High 1219.80) and 07/01/10 (Low 1010.91), there were short cycle harmonics that is shorter than King Wen sequence can resolve. Put together, the conflicts in High/Low suggests that a major consolidation both in time & magnitude has commenced.
108 trading day cycle realigned on 05/02 is due on 10/05
The Fibonacci time zone ratio 1.618 is due on 06/10, 1.786 is due on 09/27
The Long PI multiple is due on 07/05 complete schedule
Astro
As usual, This is the entertainment department.
Lets begin with two quotes:
------------------------------
MMA Comments for the Week Beginning June 6, 2011
Written by Raymond Merriman
link
...... Jupiter in Aries. Along with Uranus in Aries, this has been the cosmic engine that has propelled this bull market since summer 2010. Now half of that wild and speculative combo Jupiter leaves the wild and speculative sign of Aries.
..... Welcome to the post Asset Inflation Express era. ........ as we begin to encounter the dynamics of the Uranus in its waxing square to Pluto. Officially that begins in 2012 and lasts through 2015.
MMA Comments for the Week Beginning May 30
Written by Raymond Merriman
link
..... Jupiter is leaving that sector of the sky June 4. It ingresses into Taurus. ...... ... and then it returns partially to this sector of the heavens between October 2011 and March 2012, due to Jupiters retrograde motion. The point is that we are at a critical point in the orbit of Jupiter around the Sun. A long-term crest in the stock market is due, and a multi-year bear market is scheduled to commence once this Asset Inflation Express runs out of gas er, cosmic energy
------------------------------
Path of the Jupiter (partial map, with annotation)
http://www.nakedeyep...tm#conjunctions
http://www.cafeastro...etrogrades.html
First of all, There is some indiscernible part in Merriman's original text is considered "as is" (highlighted by blue color). While the market is entering the Turbulence, Jupiters retrograde motion (highlighted by purple color) gives a possibility that , perhaps, there is a final stretch before it head into the abyss.
------------------------------
Dec 26 2010, 05:04 PM
#54
stanley
-
- Traders-Talk User
- 167 posts
Member
Posted 06 June 2011 - 12:23 AM
Crafting the rhythms series II - 06/05/11
Turbulence before the Final Period
In essence:
Index is seemingly weakening but it is still not far from the unrealized high target.
Even though it dwells into the turbulence zone, perhaps, there is a final stretch before the index falls into the abyss.
review & update:
------------------------------
Mar 29 2011, 12:52 PM
Market is waiting a few key questions to be answered: (1) debt ceiling, (2) QE3, (3) The economy strength status.. etc. ,. Before clear answers come out, market may just swing up/down with the center line at 1310; The unrealized high targets are 1358, 1381, the unrealized low targets are 1240-1229, 1214-1222
Apr 24 2011, 12:49 PM
Index is clearly en route 1381:1173, with supports at 1320, 1302, 1277 & 1252. The recent combating zone is 1294-1336. 1381 is an important pivot to see 1402.
------------------------------
Index poked into the red box in this chart on 04/28, one trading day early than projected date. it marked an intraday high 1370.58 on 05/02. The peak is only 0.02 points shy from the historical point (08/16/2007) showed in this chart.
Now, one of the high targets 1358 has been realized, the other target 1381 remains unrealized. The noteworthy point is the mean value 1309.8 in between the recent low 1249.05 (03/16/11) and recent high 1370.58 (05/02/11), it overlaps with the aforementioned swing center line 1310. Therefore, This chart will continuously provide valuable broad view.
The near term outlook remains the same. the combating zone is 1294-1336. Supports below 1294 are: 1278-1270, 1252-1244, 1240-1229, 1222-1214; Resistance above 1336 are 1346, 1358, 1374.
Sometimes, the 'textbook' example can only serve as a guide, If you are a large swing trader, where is the Exit point? 1286, 1294 or 1234??, thus the beauty of the market, she teases the speculators to the maximum extent . So far, the 50 SMA is on top of 200 SMA, and price is on top of 1278, the overall structure is still bullish.
In 2001, a big decline came after two flat expansions , The recent softness is deploying the very similar rhythms. Will the same outcome recur?
I divide the trajectories since March low in 2009 till now according to the rhythms, not E-wave count, into a few zones. As long as the dip does not violate 1220. the bullish stance will continue. this view does not take fundamental factors into account. Things could begin the spiral down in the next few months ...
Timing window
------------------------------
Apr 24 2011, 12:49 PM
King Wen sequence prediction has at least two obvious limitations: (i) It requires some other TA indicators to nail the most likely date in a set of sequences. There are some techniques attempts on determining the next route, far beyond my scope. (ii) It cannot hunt down a harmonic cycle that is shorter than 54 trading days. [to be elaborated]
------------------------------
I left a footnote in the prior post, to be elaborated. Yes, this is the first time I see so many overlapes in High/Low dates' projection; In addition, the high 1370.58 observed on May 02 is within the time window 05/06 (the first 'possible' date in the following table.). If it is "that day", it would be the shortest time span I have tracked.
The actions since May 02 is very similar to the time period in between 04/26/10 (High 1219.80) and 07/01/10 (Low 1010.91), there are short cycle harmonics that is shorter than King Wen sequence can resolve. Put together, the conflicts in High/Low suggests that a major consolidation both in time & magnitude has commenced.
108 trading day cycle realigned on 05/02 is due on 10/05
The Fibonacci time zone ratio 1.618 is due on 06/10, 1.786 is due on 09/27
The Long PI multiple is due on 07/05 complete schedule
Astro
As usual, This is the entertainment department.
Lets begin with two quotes:
------------------------------
MMA Comments for the Week Beginning June 6, 2011
Written by Raymond Merriman
link
...... Jupiter in Aries. Along with Uranus in Aries, this has been the cosmic engine that has propelled this bull market since summer 2010. Now half of that wild and speculative combo Jupiter leaves the wild and speculative sign of Aries.
..... Welcome to the post Asset Inflation Express era. ........ as we begin to encounter the dynamics of the Uranus in its waxing square to Pluto. Officially that begins in 2012 and lasts through 2015.
MMA Comments for the Week Beginning May 30
Written by Raymond Merriman
link
..... Jupiter is leaving that sector of the sky June 4. It ingresses into Taurus. ...... ... and then it returns partially to this sector of the heavens between October 2011 and March 2012, due to Jupiters retrograde motion. The point is that we are at a critical point in the orbit of Jupiter around the Sun. A long-term crest in the stock market is due, and a multi-year bear market is scheduled to commence once this Asset Inflation Express runs out of gas er, cosmic energy
------------------------------
Path of the Jupiter (partial map, with annotation)
http://www.nakedeyep...tm#conjunctions
http://www.cafeastro...etrogrades.html
First of all, There is some indiscernible part in Merriman's original text is considered "as is" (highlighted by blue color). While the market is entering the Turbulence, Jupiters retrograde motion (highlighted by purple color) gives a possibility that , perhaps, there is a final stretch before it head into the abyss.
------------------------------
Dec 26 2010, 05:04 PM ( link )
Second Phase:
Uranus-Pluto Squares -
http://www.astrology...ranuspluto.html
06/24/12 09/19/12
05/20/13 11/01/13
04/21/14 12/15/14
03/17/15
------------------------------
Reminder:
Crafting the rhythms series does not delve on intraday speculation, it aims on trend speculation.
#55
stanley
-
- Traders-Talk User
- 167 posts
Member
Posted 16 June 2011 - 04:38 PM
I got tied up. Just a brief comments
------------------------------------
Mar 29 2011, 12:52 PM
Market is waiting a few key questions to be answered: (1) debt ceiling, (2) QE3, (3) The economy strength status.. etc. ,. Before clear answers come out, market may just swing up/down with the center line at 1310; The unrealized high targets are1358, 1381, the unrealized low targets are 1240-1229, 1214-1222
Jun 5 2011, 10:23 PM
where is the Exit point? 1286, 1294 or 1234??,
Supports below 1294 are: 1278-1270, 1252-1244, 1240-1229, 1222-1214
------------------------------------
there is a great deal of uncertainty before the June 21-22 FOMC

The broad direction speculation always can be tuned accordingly

The downward movement decelerates, however ...
16 June 2011 - 7:02 AM (session low 1258.07)

------------------------------------
Mar 29 2011, 12:52 PM
Market is waiting a few key questions to be answered: (1) debt ceiling, (2) QE3, (3) The economy strength status.. etc. ,. Before clear answers come out, market may just swing up/down with the center line at 1310; The unrealized high targets are
Jun 5 2011, 10:23 PM
where is the Exit point? 1286, 1294 or 1234??,
Supports below 1294 are: 1278-1270, 1252-1244, 1240-1229, 1222-1214
------------------------------------
there is a great deal of uncertainty before the June 21-22 FOMC
The broad direction speculation always can be tuned accordingly
The downward movement decelerates, however ...
16 June 2011 - 7:02 AM (session low 1258.07)
#56
stanley
-
- Traders-Talk User
- 167 posts
Member
Posted 20 June 2011 - 11:31 PM
some brief updates 06/20/11
Here are two active charts:
Posted 13 June 2011 - 11:32 AM

Since every trader has her/his own trading style, I can only come out the following very general comments:
(1) A 0.618 retracement from 1371 to 1173 (low on 11/16/10) is 1249.
(2) A normal 0.382 retracement out of [1371: July's low 1011] is 1233.5.
(3) A 10% correction from 1371 is 1233.9, a 15% correction is 1165 (nearby major Fib points 1175, 1152)
(4) A normal 0.236 retracement in terms of (the full range) [1371:667] is 1204.
(5) (Mar 29 2011, 12:52 PM) The unrealized high targets are1358, 1381, the unrealized low targets are 1240-1229, 1214-1222
Technicians are pretty much lined up about the critical numbers 1309-1312, 1301, 1292. 1250, 1240 ...
However, the short term scope is very limited due to the upcoming news [Greece, FOMC .. etc]
Posted 17 June 2011, 11:08 AM

This past 6 sessions were quick traders' show.
A speculation chart was posted in the morning session with a recap after the closing bell.
The records indicated the index movements were under 'controlled', no panic yet.
HI 1278.00 vs. 1277.04 off 0.96
LO1265.6 0 vs. 1265.64 off 0.04
Posted 13 June 2011 - 11:32 AM chart
Posted 13 June 2011 - 01:47 PM chart
HI 1295.00 vs. 1292.50 off 2.50
LO 1274.80 vs. 1272.22 off 2.58
Posted 14 June 2011 - 12:11 PM chart chart
HI 1287.00 vs. 1287.87 off 0.87
LO 1261.70 vs. 1267.07 0ff 0.63
Posted 15 June 2011 - 11:03 AM chart
Posted 15 June 2011 - 03:55 PM chart
HI 1273.80 vs. 1274.11 off 0.31
LO 1258.40 vs. 1258.07 off 0.33
Posted 16 June 2011 - 11:02 AM chart
Posted 16 June 2011 - 04:03 PM chart
HI 1278.60 vs. 1279.82 off 1.22
LO 1268.30 vs. 1267.40 off 0.90
Posted 17 June 2011, 11:08 AM chart
HI 1279.30 vs. 1280.42 off 1.12
LO 1268.30 vs. 1267.56 0ff 0.74
Posted 20 June 2011, 10:40 AM chart
Here are two active charts:
Posted 13 June 2011 - 11:32 AM
Since every trader has her/his own trading style, I can only come out the following very general comments:
(1) A 0.618 retracement from 1371 to 1173 (low on 11/16/10) is 1249.
(2) A normal 0.382 retracement out of [1371: July's low 1011] is 1233.5.
(3) A 10% correction from 1371 is 1233.9, a 15% correction is 1165 (nearby major Fib points 1175, 1152)
(4) A normal 0.236 retracement in terms of (the full range) [1371:667] is 1204.
(5) (Mar 29 2011, 12:52 PM) The unrealized high targets are
Technicians are pretty much lined up about the critical numbers 1309-1312, 1301, 1292. 1250, 1240 ...
However, the short term scope is very limited due to the upcoming news [Greece, FOMC .. etc]
Posted 17 June 2011, 11:08 AM
This past 6 sessions were quick traders' show.
A speculation chart was posted in the morning session with a recap after the closing bell.
The records indicated the index movements were under 'controlled', no panic yet.
HI 1278.00 vs. 1277.04 off 0.96
LO1265.6 0 vs. 1265.64 off 0.04
Posted 13 June 2011 - 11:32 AM chart
Posted 13 June 2011 - 01:47 PM chart
HI 1295.00 vs. 1292.50 off 2.50
LO 1274.80 vs. 1272.22 off 2.58
Posted 14 June 2011 - 12:11 PM chart chart
HI 1287.00 vs. 1287.87 off 0.87
LO 1261.70 vs. 1267.07 0ff 0.63
Posted 15 June 2011 - 11:03 AM chart
Posted 15 June 2011 - 03:55 PM chart
HI 1273.80 vs. 1274.11 off 0.31
LO 1258.40 vs. 1258.07 off 0.33
Posted 16 June 2011 - 11:02 AM chart
Posted 16 June 2011 - 04:03 PM chart
HI 1278.60 vs. 1279.82 off 1.22
LO 1268.30 vs. 1267.40 off 0.90
Posted 17 June 2011, 11:08 AM chart
HI 1279.30 vs. 1280.42 off 1.12
LO 1268.30 vs. 1267.56 0ff 0.74
Posted 20 June 2011, 10:40 AM chart
#57
stanley
-
- Traders-Talk User
- 167 posts
Member
Posted 26 June 2011 - 11:16 PM
Crafting the rhythms series II 06/26/11
Navigating Through the Turbulence
Review:
------------------------------------------------------------------
(Dates are time stamps in this thread)
Dec 7 2010, 07:40 PM,
My works suggest that the SPX 1265 is a critical pivot.
As long as the index can surmount this pivot, next target is 1310 or even higher.
(There were 6 posts in this thread mentioned 1265)
Feb 2 2011, 11:26 AM
Mar 13 2011, 11:48 PM
The center line is 1310, upper rail 1381, and lower rail 1229.
This downward move may hit 1229-1214. When index, indeed, hits 1214, will review the possibility to see 1175 or even lower numbers
Mar 29 2011, 12:52 PM
The unrealized high target are1358, 1381, the unrealized low target are 1240-1229, 1214-1222
Jun 6 2011, 12:23 AM
where is the Exit point? 1286, 1294 or 1234?
chart
----------------------------------------------------------------------
This ongoing Turbulence has been 39 trading days already (05/02 06/24). With many signals on hand, the fundamentalists 'suggested' the thing will go spiral down fast. only time will tell.
Where is the low point from there the bounce has lesser chance to deploy a new high? The peak 1219.80 (04/26/10) & 12207.08 (11/06/11) in this chart could be a good reference. when index moves below 1219.80 it triggers an overlap condition.
Timing wise, the blue color box to the right in this chart (Sep 4, Sep 19 2010) gives a rough sense, a time window in between 06/15 to 08/05 may plot a low that can last one to two months; The 700 PI is due on 07/05, ( Here is the complete table ); Bradley Turn Dates are 06/16, 06/22, 07/29-30. It is interesting to note that the rolling points from a yearly high and yearly low in the Siderograph output has always been highlighted as important turn dates. There is a positional information that is indiscernible.
The King Wen sequence nailed the secondary terminal points within +/- 1 trading, i.e. high 05/19, 06/01, low 06/15. but does not hint the polarity for 06/28-29, and 07/12. the current set of the whole sequence will need to be reconciled, here is a partial list, based on the King Wen sequence ; In the past 6 weeks, the index already deployed a few short cycle harmonics. these behaviors let the short term cycle speculation much like flipping a coin.
The projections listed in following chart has arrested half dozen terminal points, worth a repost
Posted 13 June 2011 - 11:32 AM
Based on the latest data, a new set of suggested lower terminal points can be found in this chart.
0.707 is the half power point ( 0.5 = 0.707 * 0.707 ). The recent high 1371 (05/02) & 1249 (03/16) proved 1310 is the middle point.;
The half power point 1266 in between 1371 & 1011 is an important gauge. When index slips below 1266, it has good odds to hit the suggested terminal points 1250, 1240, 1221. In the opposite direction, 1313-1329 is the gauge to say the index will not re-probe the 1266 zone for a while.
1371:1249 mean 1310
1371:1229 mean 1300, 0.707 1329 1270, 0.786 1260, ----, 0.236 1262
1371:1173 mean 1272, 0.707 1313 1231, 0.786 1215, ----, 0.236 1219
1371:1011 mean 1191, 0.707 1266 1117, 0.786 1294 1088, 0.236 1095
1371:0667 mean 1019, 0.707 1164
Due to very heavy schedule, the posting efforts for 'Crafting the rhythms series II' will be reduced.
Navigating Through the Turbulence
Review:
------------------------------------------------------------------
(Dates are time stamps in this thread)
Dec 7 2010, 07:40 PM,
My works suggest that the SPX 1265 is a critical pivot.
As long as the index can surmount this pivot, next target is 1310 or even higher.
(There were 6 posts in this thread mentioned 1265)
Feb 2 2011, 11:26 AM
Mar 13 2011, 11:48 PM
The center line is 1310, upper rail 1381, and lower rail 1229.
This downward move may hit 1229-1214. When index, indeed, hits 1214, will review the possibility to see 1175 or even lower numbers
Mar 29 2011, 12:52 PM
The unrealized high target are
Jun 6 2011, 12:23 AM
where is the Exit point? 1286, 1294 or 1234?
chart
----------------------------------------------------------------------
This ongoing Turbulence has been 39 trading days already (05/02 06/24). With many signals on hand, the fundamentalists 'suggested' the thing will go spiral down fast. only time will tell.
Where is the low point from there the bounce has lesser chance to deploy a new high? The peak 1219.80 (04/26/10) & 12207.08 (11/06/11) in this chart could be a good reference. when index moves below 1219.80 it triggers an overlap condition.
Timing wise, the blue color box to the right in this chart (Sep 4, Sep 19 2010) gives a rough sense, a time window in between 06/15 to 08/05 may plot a low that can last one to two months; The 700 PI is due on 07/05, ( Here is the complete table ); Bradley Turn Dates are 06/16, 06/22, 07/29-30. It is interesting to note that the rolling points from a yearly high and yearly low in the Siderograph output has always been highlighted as important turn dates. There is a positional information that is indiscernible.
The King Wen sequence nailed the secondary terminal points within +/- 1 trading, i.e. high 05/19, 06/01, low 06/15. but does not hint the polarity for 06/28-29, and 07/12. the current set of the whole sequence will need to be reconciled, here is a partial list, based on the King Wen sequence ; In the past 6 weeks, the index already deployed a few short cycle harmonics. these behaviors let the short term cycle speculation much like flipping a coin.
The projections listed in following chart has arrested half dozen terminal points, worth a repost
Posted 13 June 2011 - 11:32 AM
Based on the latest data, a new set of suggested lower terminal points can be found in this chart.
0.707 is the half power point ( 0.5 = 0.707 * 0.707 ). The recent high 1371 (05/02) & 1249 (03/16) proved 1310 is the middle point.;
The half power point 1266 in between 1371 & 1011 is an important gauge. When index slips below 1266, it has good odds to hit the suggested terminal points 1250, 1240, 1221. In the opposite direction, 1313-1329 is the gauge to say the index will not re-probe the 1266 zone for a while.
1371:1249 mean 1310
1371:1229 mean 1300, 0.707 1329 1270, 0.786 1260, ----, 0.236 1262
1371:1173 mean 1272, 0.707 1313 1231, 0.786 1215, ----, 0.236 1219
1371:1011 mean 1191, 0.707 1266 1117, 0.786 1294 1088, 0.236 1095
1371:0667 mean 1019, 0.707 1164
Due to very heavy schedule, the posting efforts for 'Crafting the rhythms series II' will be reduced.
#58
stanley
-
- Traders-Talk User
- 167 posts
Member
Posted 02 July 2011 - 05:50 PM
Crafting the rhythms series II
07/02 punching through the Turbulence
Review:
06/05/11 Turbulence before the Final Period link
While the market is entering the Turbulence, ..., perhaps, there is a final stretch.
(final stretch October 2011 and March 2012 )
chart
06/26/11 Navigating Through the Turbulence link
The half power point 1266 in between 1371 & 1011 is an important gauge. When index slips below 1266, it has good odds to hit the suggested terminal points 1250, 1240, 1221. In the opposite direction, 1313-1329 is the gauge to say the index will not re-probe the 1266 zone for a while.
Outlook:
07/02/11 Punching through the Turbulence

The key point 1265 was labeled in in this chart . (Apr 24 2011, 12:49 PM)
On 06/16, index marked a low 1258.06, indeed, it dipped below 1266 briefly. But, it closed at 1267.64.
In addition, the prediction in this chart (Jun 16 2011, 04:38 PM ) based on King-Wens sequence showed its prediction quality, off just one trading day. Then, the index takes out 1329 decisively on 07/01. This is a signal to say that the succeeding pullbacks may have low odds to probe the unrealized low targets 1240-1229, 1214-1222. The next time window is around 09/27 - 10/05.
Apr 24 2011, 12:49 PM
Index is clearly en route 1381:1173, with supports at 1320, 1302, 1277 & 1252. 1381 is an important pivot to see 1402.
On 07/01, the intraday high 1341.01 is the 0.809 retracement between the active route 1173 & 1381. where 1381 is an unrealized high target.
There is a good reason why the following chart put 1440 out there.
Jan 2 2011
The center line is 1310 (1309), upper rail 1381, and lower rail 1229(1228).
Time is a magic machine. It moves quietly, but, its vicissitudinary color let us exclaim.
Red Lily in full blossom
viedo: http://www.youtube.c...feature=related
don't have too much time watch the market, this is the last post for Crafting the rhythms series.
In a foreseeable future, there will be a new series.
07/02 punching through the Turbulence
Review:
06/05/11 Turbulence before the Final Period link
While the market is entering the Turbulence, ..., perhaps, there is a final stretch.
(final stretch October 2011 and March 2012 )
chart
06/26/11 Navigating Through the Turbulence link
The half power point 1266 in between 1371 & 1011 is an important gauge. When index slips below 1266, it has good odds to hit the suggested terminal points 1250, 1240, 1221. In the opposite direction, 1313-1329 is the gauge to say the index will not re-probe the 1266 zone for a while.
Outlook:
07/02/11 Punching through the Turbulence
The key point 1265 was labeled in in this chart . (Apr 24 2011, 12:49 PM)
On 06/16, index marked a low 1258.06, indeed, it dipped below 1266 briefly. But, it closed at 1267.64.
In addition, the prediction in this chart (Jun 16 2011, 04:38 PM ) based on King-Wens sequence showed its prediction quality, off just one trading day. Then, the index takes out 1329 decisively on 07/01. This is a signal to say that the succeeding pullbacks may have low odds to probe the unrealized low targets 1240-1229, 1214-1222. The next time window is around 09/27 - 10/05.
Apr 24 2011, 12:49 PM
Index is clearly en route 1381:1173, with supports at 1320, 1302, 1277 & 1252. 1381 is an important pivot to see 1402.
On 07/01, the intraday high 1341.01 is the 0.809 retracement between the active route 1173 & 1381. where 1381 is an unrealized high target.
There is a good reason why the following chart put 1440 out there.
Jan 2 2011
The center line is 1310 (1309), upper rail 1381, and lower rail 1229(1228).
Time is a magic machine. It moves quietly, but, its vicissitudinary color let us exclaim.
Red Lily in full blossom
viedo: http://www.youtube.c...feature=related
don't have too much time watch the market, this is the last post for Crafting the rhythms series.
In a foreseeable future, there will be a new series.
#59
stanley
-
- Traders-Talk User
- 167 posts
Member
Posted 17 July 2011 - 09:07 PM
The quest for 108

[A] Review:
Overall review on some speculation works posted in the past three months
(1) King Wen's Sequence
Old table

Here is a tentative projection table, it assumes in the just passed sequence 1370.58 is the high [observed on 05/02] & 1258.07 is the low [observed on 06/16]. The wording 'tentative' can be removed when there is a better confirmation. Each complete King Wen's sequence has 9 possible outcomes (81,126,63,108,90,99,54,117,72) that ties with a peak/valley. The primary number 108 suggests the King Wen's Sequence is a good tool to explore the short term harmonic within a 108 trading day cycle. Due to this nature, the prediction method cannot determine whether the projected date is a secondary or primary event. more serious reading can be found in 'The 108 in King Wen's Sequence' By J.M. Berger http://iching.egople.../hidden108.html
To avoid confusion, only the first few possible dates is tabulated.

(2) 108 trading day cycle
108 trading day cycle realigned on 05/02, the next one is due on 10/05
The projected date was 04/28, the actual date was 05/02, off 2 to 3 trading days.
Posted 15 April 2011 - 06:39 PM post #5 link
108 trading days cycle is a medium rage time frame cycle. this cycle comes & goes, not a easy one to catch. A few passed cycles can be found in this chart .
The relationship with the famous Martin Armstrong (Economic Confidence Model) 8.6 year business cycle is clear: since each year has an averaged 251 trading days, 8.6 year has 251 * 8.6 + 2 (leap year adjustmnet) = 2160.6 trading days, = 20 * 108 ( off 0.6 trading day). The 108 trading day cycle also links to the 108 in King Wen's Sequence which covers the short cycles.
So, each Martin Armstrong 8.6 year cycle has 20 108 trading cycle. The unit of 20 is not new,
Looks at this table: there are 3 counting use 20 as a 'cycle' in the Mayan Date in Long Count format.

Current Mayan Date (as of 07/16/2011) ( use this link http://www.sacred-te...cal/mayacal.htm )
baktun 12 katun 19 tun 18 uinal 9 kin 16
The "roll over" of the most significant number (Baktun) from 12 to 13 will take place on December 21 2012. ( baktun 13 katun 0 tun 0 uinal 0 kin 0 ) [in academic field this is a debatable counting, don't be too serious]. The date draws lots attention.
[3] Long PI multiple
100 * PI trading days is a large time, the window is as wide as 12 * PI.
it has a close relationship with the fibonacci number 987 ( PI * PI * 100 = 986.96 )
1, 1, 2, 3, 5, 8, 13, 21, 34, 55, 89, 144, 233, 377, 610, 987, 1597, 2584, 4181, 6765 . . .
Note that Martin Armstrong 8.6 year cycle links to 1000 * PI ( 3141.6) calendar days, 8.6 * 365.25 = 3141.15, however, the total trading days in between Black Monday 1987 to Dot COM peak March 2000 is 1000 * PI, off only 0.7.
The significance of 07/05/11 still needs to be reconciled, may be it is a secondary event.
Posted 22 April 2011 - 05:28 PM, Post #31, link
The Long PI multiple projection gives a hint that time period Dec - OCT 2012 may not be that "KBooooom" date. after you go over the info in the later paragraphs you may realize this hint.
(4) Fibonacci time zone ratio
The Fibonacci time zone ratio 1.618 was due on 06/10, 1.786 is due on 09/27
The actual date was 06/16. off 3-4 trading date. The is a large time frame ratio, don't expect high accuracy.
(5) Astro
Lets begin with two quotes:
------------------------------
MMA Comments for the Week Beginning June 6, 2011
Written by Raymond Merriman
link
...... Jupiter in Aries. Along with Uranus in Aries, this has been the cosmic engine that has propelled this bull market since summer 2010. Now half of that wild and speculative combo Jupiter leaves the wild and speculative sign of Aries.
..... Welcome to the post Asset Inflation Express era. ........ as we begin to encounter the dynamics of the Uranus in its waxing square to Pluto. Officially that begins in 2012 and lasts through 2015. (I put a Note)
MMA Comments for the Week Beginning May 30
Written by Raymond Merriman
link
..... Jupiter is leaving that sector of the sky June 4. It ingresses into Taurus. ...... ... and then it returns partially to this sector of the heavens between October 2011 and March 2012, due to Jupiters retrograde motion. The point is that we are at a critical point in the orbit of Jupiter around the Sun. A long-term crest in the stock market is due, and a multi-year bear market is scheduled to commence once this Asset Inflation Express runs out of gas er, cosmic energy
------------------------------
Path of the Jupiter (partial map, with annotation)
http://www.nakedeyep...tm#conjunctions
http://www.cafeastro...etrogrades.html
First of all, There is some indiscernible part in Merriman's original text is considered "as is" (highlighted by blue color). While the market is entering the Turbulence, Jupiters retrograde motion (highlighted by purple color) gives a possibility that , perhaps, there is a final stretch before it head into the abyss.
Note:
Uranus-Pluto Squares -
http://www.astrology...ranuspluto.html
06/24/12 09/19/12
05/20/13 11/01/13
04/21/14 12/15/14
03/17/15
Posted on Posted Jun 26 2011, 08:16 PM
Timing wise, the blue color box to the right in this chart gives a rough sense, a time window in between 06/15 to 08/05 may plot a low that can last one to two months; The 700 PI is was due on 07/05; Bradley Turn Dates are 06/16, 06/22, 07/29-30. It is interesting to note that the rolling points from a yearly high and yearly low in the Siderograph output has always been highlighted as important turn dates. This understanding is not what you have been told, there is a positional information that is indiscernible.
[B] Outlook summary
(1) near term high/low dates: http://www.capitalst...08452181876.jpg
(2) Bradley Turn Dates are 06/16, 06/22, 07/29-30,
complete dates in this copyright chart: http://forbestadvice...bradley2011.GIF
(3) The Fibonacci time zone ratio 1.786 is due on 09/27
(4) 108 trading day cycle realigned on 05/02, the next one is due on 10/05
(5) Broad Time window to watch in between October 2011 and March 2012
(6) Long PI multipler 800 * PI Oct 2012
(7) Time window further extended
warning! contains full stream of pessimistic info.
This post (by Fibo-Nacy & Stanley) serves as a bridge to the upcoming Crafting the rhythms series III
The posting efforts may resume after October 2011.

[A] Review:
Overall review on some speculation works posted in the past three months
(1) King Wen's Sequence
Old table
Here is a tentative projection table, it assumes in the just passed sequence 1370.58 is the high [observed on 05/02] & 1258.07 is the low [observed on 06/16]. The wording 'tentative' can be removed when there is a better confirmation. Each complete King Wen's sequence has 9 possible outcomes (81,126,63,108,90,99,54,117,72) that ties with a peak/valley. The primary number 108 suggests the King Wen's Sequence is a good tool to explore the short term harmonic within a 108 trading day cycle. Due to this nature, the prediction method cannot determine whether the projected date is a secondary or primary event. more serious reading can be found in 'The 108 in King Wen's Sequence' By J.M. Berger http://iching.egople.../hidden108.html
To avoid confusion, only the first few possible dates is tabulated.
(2) 108 trading day cycle
108 trading day cycle realigned on 05/02, the next one is due on 10/05
The projected date was 04/28, the actual date was 05/02, off 2 to 3 trading days.
Posted 15 April 2011 - 06:39 PM post #5 link
108 trading days cycle is a medium rage time frame cycle. this cycle comes & goes, not a easy one to catch. A few passed cycles can be found in this chart .
The relationship with the famous Martin Armstrong (Economic Confidence Model) 8.6 year business cycle is clear: since each year has an averaged 251 trading days, 8.6 year has 251 * 8.6 + 2 (leap year adjustmnet) = 2160.6 trading days, = 20 * 108 ( off 0.6 trading day). The 108 trading day cycle also links to the 108 in King Wen's Sequence which covers the short cycles.
So, each Martin Armstrong 8.6 year cycle has 20 108 trading cycle. The unit of 20 is not new,
Looks at this table: there are 3 counting use 20 as a 'cycle' in the Mayan Date in Long Count format.
Current Mayan Date (as of 07/16/2011) ( use this link http://www.sacred-te...cal/mayacal.htm )
baktun 12 katun 19 tun 18 uinal 9 kin 16
The "roll over" of the most significant number (Baktun) from 12 to 13 will take place on December 21 2012. ( baktun 13 katun 0 tun 0 uinal 0 kin 0 ) [in academic field this is a debatable counting, don't be too serious]. The date draws lots attention.
[3] Long PI multiple
100 * PI trading days is a large time, the window is as wide as 12 * PI.
it has a close relationship with the fibonacci number 987 ( PI * PI * 100 = 986.96 )
1, 1, 2, 3, 5, 8, 13, 21, 34, 55, 89, 144, 233, 377, 610, 987, 1597, 2584, 4181, 6765 . . .
Note that Martin Armstrong 8.6 year cycle links to 1000 * PI ( 3141.6) calendar days, 8.6 * 365.25 = 3141.15, however, the total trading days in between Black Monday 1987 to Dot COM peak March 2000 is 1000 * PI, off only 0.7.
The significance of 07/05/11 still needs to be reconciled, may be it is a secondary event.
Posted 22 April 2011 - 05:28 PM, Post #31, link
The Long PI multiple projection gives a hint that time period Dec - OCT 2012 may not be that "KBooooom" date. after you go over the info in the later paragraphs you may realize this hint.
(4) Fibonacci time zone ratio
The Fibonacci time zone ratio 1.618 was due on 06/10, 1.786 is due on 09/27
The actual date was 06/16. off 3-4 trading date. The is a large time frame ratio, don't expect high accuracy.
(5) Astro
Lets begin with two quotes:
------------------------------
MMA Comments for the Week Beginning June 6, 2011
Written by Raymond Merriman
link
...... Jupiter in Aries. Along with Uranus in Aries, this has been the cosmic engine that has propelled this bull market since summer 2010. Now half of that wild and speculative combo Jupiter leaves the wild and speculative sign of Aries.
..... Welcome to the post Asset Inflation Express era. ........ as we begin to encounter the dynamics of the Uranus in its waxing square to Pluto. Officially that begins in 2012 and lasts through 2015. (I put a Note)
MMA Comments for the Week Beginning May 30
Written by Raymond Merriman
link
..... Jupiter is leaving that sector of the sky June 4. It ingresses into Taurus. ...... ... and then it returns partially to this sector of the heavens between October 2011 and March 2012, due to Jupiters retrograde motion. The point is that we are at a critical point in the orbit of Jupiter around the Sun. A long-term crest in the stock market is due, and a multi-year bear market is scheduled to commence once this Asset Inflation Express runs out of gas er, cosmic energy
------------------------------
Path of the Jupiter (partial map, with annotation)
http://www.nakedeyep...tm#conjunctions
http://www.cafeastro...etrogrades.html
First of all, There is some indiscernible part in Merriman's original text is considered "as is" (highlighted by blue color). While the market is entering the Turbulence, Jupiters retrograde motion (highlighted by purple color) gives a possibility that , perhaps, there is a final stretch before it head into the abyss.
Note:
Uranus-Pluto Squares -
http://www.astrology...ranuspluto.html
06/24/12 09/19/12
05/20/13 11/01/13
04/21/14 12/15/14
03/17/15
Posted on Posted Jun 26 2011, 08:16 PM
Timing wise, the blue color box to the right in this chart gives a rough sense, a time window in between 06/15 to 08/05 may plot a low that can last one to two months; The 700 PI
[B] Outlook summary
(1) near term high/low dates: http://www.capitalst...08452181876.jpg
(2) Bradley Turn Dates are 06/16, 06/22, 07/29-30,
complete dates in this copyright chart: http://forbestadvice...bradley2011.GIF
(3) The Fibonacci time zone ratio 1.786 is due on 09/27
(4) 108 trading day cycle realigned on 05/02, the next one is due on 10/05
(5) Broad Time window to watch in between October 2011 and March 2012
(6) Long PI multipler 800 * PI Oct 2012
(7) Time window further extended
warning! contains full stream of pessimistic info.
Clarifying the Timeline of Change
a commentary by Bill Herbst, 8 June 2011, version 1.2
June 24, 2012 is the critical mass point, the date of the initial partile pass of Uranus in first-quarter square to Pluto (exactly 90° ahead). That day, month, and even season does not, however, represent any great awakening. Rather, it is simply the first of the seven exact passes Uranus will make to Pluto over the three years from summer 2012 through spring 2015. In terms of real events that go with the symbolism, however, we have to stretch out the timeline, extending it for many years before and after 2012.
The Saturn-Uranus-Pluto T-square that is Step 1 of the Texas-Two-Step---with its hallmark of denial---will end in August 2011, fully ten months before Step 2, the Uranus-Pluto square---full shock and awe --- begins to gear up
full commentary: http://www.billherbst.com/Comm2.pdf
This post (by Fibo-Nacy & Stanley) serves as a bridge to the upcoming Crafting the rhythms series III
The posting efforts may resume after October 2011.
#60
stanley
-
- Traders-Talk User
- 167 posts
Member
Posted 20 August 2011 - 07:13 PM
Connecting the dots - 08/20/2011
by Fibo-Nacy & Stanley
Review and outlook.
Target 1358, 1240-1229, 1214-1222 has been met. The recent high 1371 is very close to the unrealized target 1381.
Long term target is different from 'the Bottom' target .
secondary highs after 1371 are 1256.48 (07/07) and 1346.10 (07/22), then index reversed, and cratered at 1101.54 (08/09).. These secondary highs were retests of the red color box in this chart
Index closed below 1294 on 07/29, chart gave the best explanation why 07/29 is an important check date
Index marked a low at 1101.54 on 08/09, only two trading days after 08/05
(tentative)

On 08/17, index retraced up to 1208.47, then reversed ....

The Fibonacci time zone ratio 1.786 is due on 09/27
108 trading day cycle realigned on 05/02, the next one is due on 10/05
Broad Time window to watch in between October 2011 and March 2012
Long PI multipler 800 * PI Oct 2012 ( the unconfirmed 700*PI date was marked on 08/09 (scheduled 07/05), actual number is 707.6 PI)
by Fibo-Nacy & Stanley
Review and outlook.
Mar 29 2011, 09:52 AM
http://www.traders-t...?...st&p=569917
The unrealized high target are 1358, 1381, the unrealized low target are 1240-1229, 1214-1222
Target 1358, 1240-1229, 1214-1222 has been met. The recent high 1371 is very close to the unrealized target 1381.
Apr 24 2011, 09:49 AM
http://www.traders-t...?...st&p=574270
Long term projection
I have a tentative estimate for S&P 500 index low target. It is around 950 (940-972).
Long term target is different from 'the Bottom' target .
Jun 5 2011, 09:04 PM
http://www.traders-t...?...st&p=580315
Sometimes, the 'textbook' example can only serve as a guide, If you are a large swing trader, where is the Exit point? 1286, 1294 or 1234??, thus the beauty of the market, she teases the speculators to the maximum extent.
chart: http://indexcalls.co...10137_thumb.jpg
I divide the trajectories since March low in 2009 till now according to the rhythms, not E-wave count, into a few zones. As long as the dip does not violate 1220. the bullish stance will continue. this view does not take fundamental factors into account. Things could begin the spiral down in the next few months ...
chart: http://indexcalls.co...62814_thumb.jpg
The actions since May 02 is very similar to the time period in between 04/26/10 (High 1219.80) and 07/01/10 (Low 1010.91), there were short cycle harmonics that is shorter than King Wen sequence can resolve. Put together, the conflicts in High/Low suggests that a major consolidation both in time & magnitude has commenced.
Jun 26 2011, 08:16 PM
http://www.traders-t...?...st&p=583261
This ongoing Turbulence has been 39 trading days already (05/02 06/24). With many signals on hand, the fundamentalists 'suggested' the thing will go spiral down fast. only time will tell.
Timing wise, the blue color box to the right in this chart (Sep 4, Sep 19 2010) gives a rough sense, a time window in between 06/15 to 08/05 may plot a low that can last one to two months;
Fibo-Nacy Posted on 11 July 2011 - 03:53 PM
Post # 73 http://www.capitalst...p...st&p=854959
intraday low 1316.61.
Bulls' safe margin has been further compressed, the immediate supports gear down to 1314 & 1310; Time clock is ticking ....
they cannot afford to lose the 1302 & 1298.61-1294 in the next 2 sessions, a condition as dire as 'incurable' ( Irréversible )
Fibo-Nacy Posted on 18 July 2011 - 12:45 PM
post #60 http://www.capitalst...p...st&p=855556
Market is approaching to that precious moment again.
As long as bulls can defend 1294, it is about time (in 0/2 days) index will turn up again.
check date 07/18, 07/25, 07/29
Fibo-Nacy Posted on 21 July 2011 - 11:33 AM
post #37 http://www.capitalst...p...st&p=855806
Index has avoided the catastrophic scenario (dips below 1294),
Bull is not yet out of the woods. check date is 07/25, then 07/29. [also the Bradley turn date]. Should Index surmount 1358 (0.809 1440-1011) after 07/29 that says the short cycle harmonics since 05/02 (1370.58) has dampened out. Such scenario also reinstates the possibility of the bullish rhythms,
secondary highs after 1371 are 1256.48 (07/07) and 1346.10 (07/22), then index reversed, and cratered at 1101.54 (08/09).. These secondary highs were retests of the red color box in this chart
Fibo-Nacy Posted on 31 July 2011 - 12:01 AM
post #40 http://www.capitalst...p...st&p=856671
S&P500 index drove below 1294 on 07/29, it closed at 1292.28 (1292 is 0.809 out of 1440 & 667), a point slightly below the critical point 1294. The aberration is within the margin; The intraday low 1282.86 ( 1282.14 is 0.786 out of 1370.58 & 1258.07) gives a slightly negative bias. In overall, index is in the weak Lagrangian points ( http://en.wikipedia....agrangian_point ) that can move in either direction quickly.

Index closed below 1294 on 07/29, chart gave the best explanation why 07/29 is an important check date
Fibo-Nacy Posted on 02 August 2011 - 03:04 PM
post #77 http://www.capitalst...p...st&p=856945
Index passed 1294 on 07/29, the next check date is 08/05.
Fibo-Nacy Posted on 04 August 2011 - 11:56 AM
post #101 http://www.capitalst...p...st&p=857227
intraday low 1216.16
index moved 1.236 of (1370.58-1258.07, at 1217.42). The long awaited unrealized low target zone 1240-1229 & 1214-1222 has been breached.
there is no hint that 1214-1222 is the "low". check date is 08/05. check point is 1249.74 (min. confirmation criteria). the Market is the boss.
Index marked a low at 1101.54 on 08/09, only two trading days after 08/05
(tentative)
Fibo-Nacy Posted on 06 August 2011 - 04:37 PM
post #66 http://www.capitalst...p...st&p=857634
On May 2, 2011 index marked a high 1,370.58 then reversed
Jun 27 2010, 05:27 PM (traders-talk.com)
The middle term wave structure is ambiguous so it is premature to pick a number to gauge whether the rally since March 2009 is complete or not. The following chart embedded with quite a few scenarios. Anyway, in between July/August, index will deploy enough trajectory for speculator to determine the status of the primary wave B. Be flexible, Wave count is subjective also evolves with time.
The termination of wave B? requires confirmation. One may use 1102 (0.382 1371-667) as a gauge; Index dipped below 1176 on 08/05 intraday gave an early confirmation signal.
Wave count for reference only, it evolves with time.
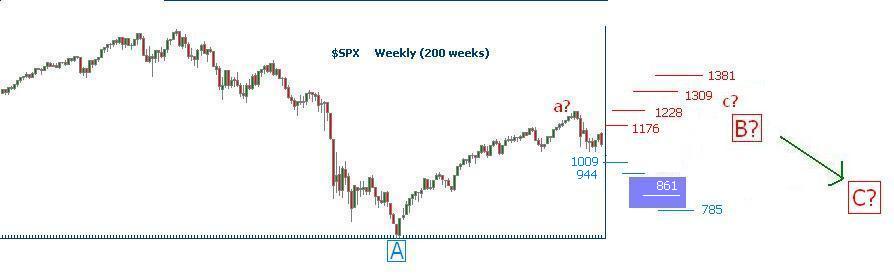

Posted on 10 August 2011 - 12:43 PM
Post #66 http://www.capitalst...p...st&p=858446

On 08/17, index retraced up to 1208.47, then reversed ....
Fibo-Nacy Posted on 12 August 2011 - 04:05 PM
post #94 http://www.capitalst...p...st&p=858979
1102 is the trend reversal confirmation point. However it is becoming clear that Bull cannot lose 1054, otherwise, a landslide will take place.[long term target 950]
The Fibonacci time zone ratio 1.786 is due on 09/27
108 trading day cycle realigned on 05/02, the next one is due on 10/05
Broad Time window to watch in between October 2011 and March 2012
Long PI multipler 800 * PI Oct 2012 ( the unconfirmed 700*PI date was marked on 08/09 (scheduled 07/05), actual number is 707.6 PI)


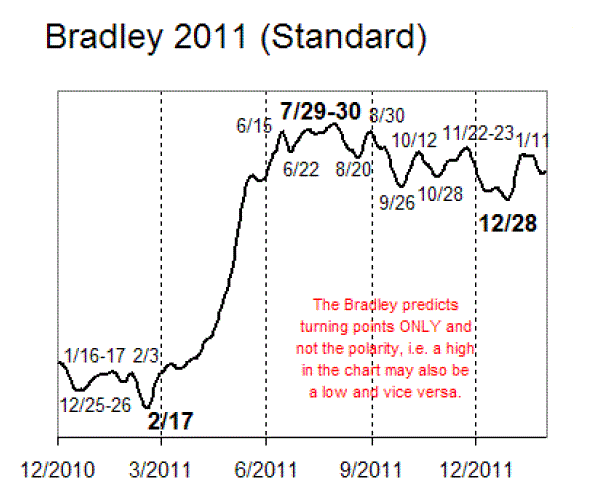