10/03/2011
Why do maple leaves change colour in the fall?
this poster is not a registered investment advisor, comments posted in this thread are for entertainment purposes only.
Recap:
(1)
06/26
a time window in between 06/15 to 08/05 may plot a low that can last one to two months (
link)
08/06
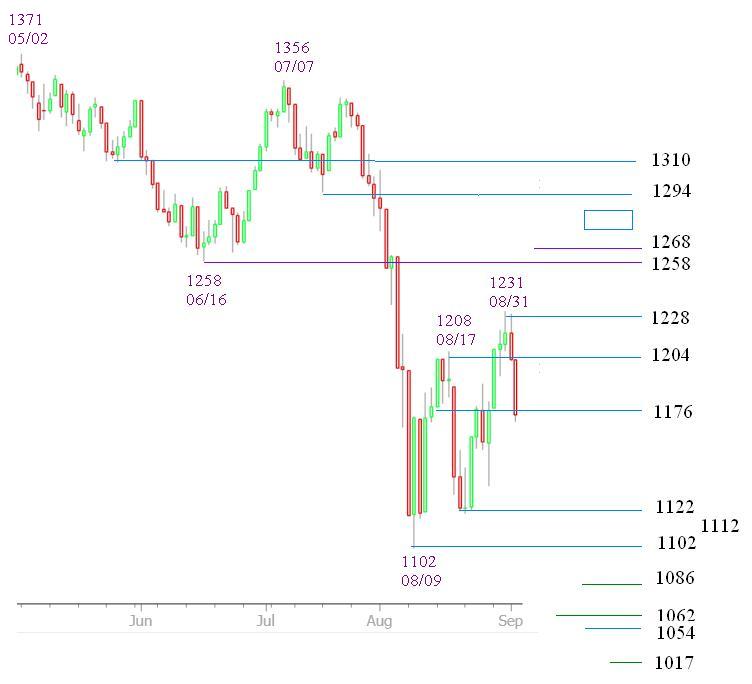
The termination of wave B? requires confirmation. One may use 1102 (0.382 1371-667) as a gauge (
link post #66)
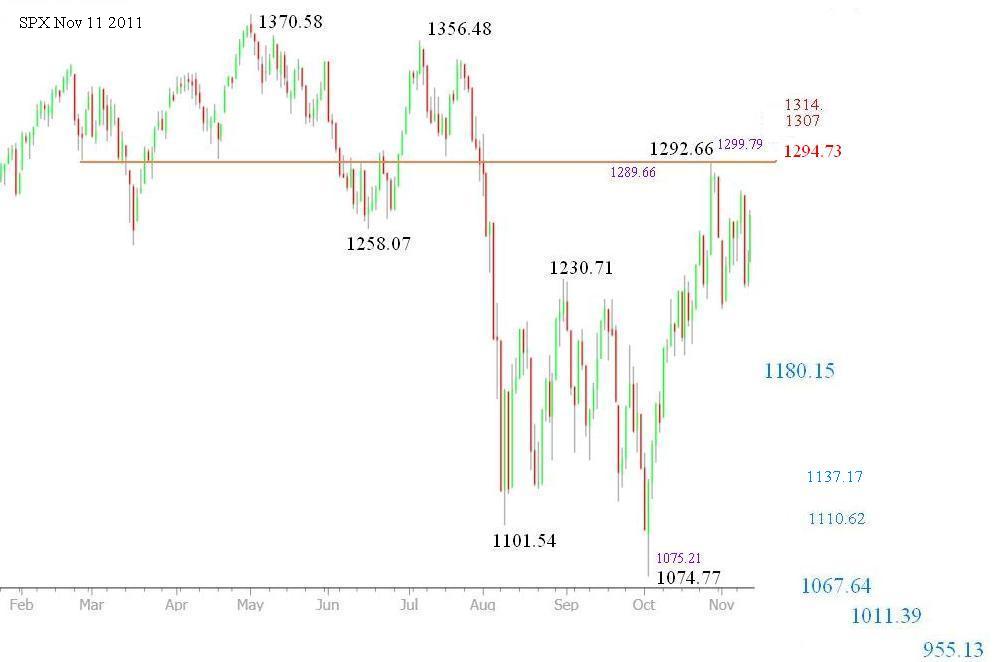
The low marked on 08/09 has held up almost two months, not any more. Index plotted an intraday low 1098.92 on 10/03. Trend reversal confirmation has been granted.
(2)
08/12
1102 is the trend reversal confirmation point. However it is becoming clear that Bull cannot lose 1054, otherwise, a landslide will take place.[long term target 950]" (
link post #94)
950 (940-972) was the tentative long term low target I made on 04/24/11.
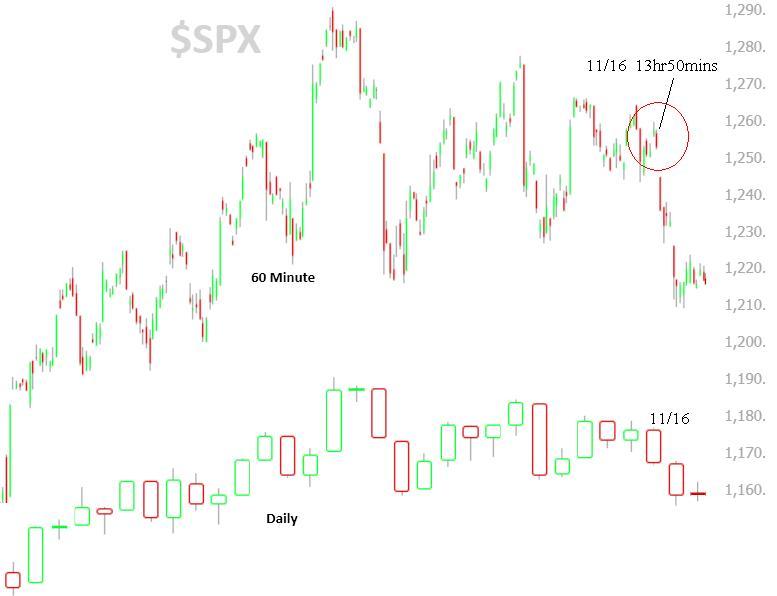
(3) Index bounced off 1102 and revisited 1102, it forms an interesting pattern in
this chart, deviated from a triangle, a wedge, not closer to a diagonal. Market has her own script.
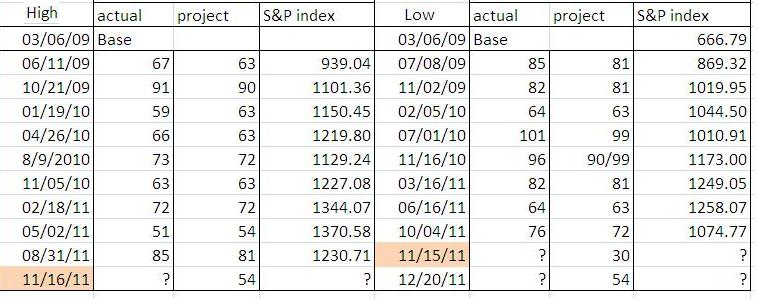
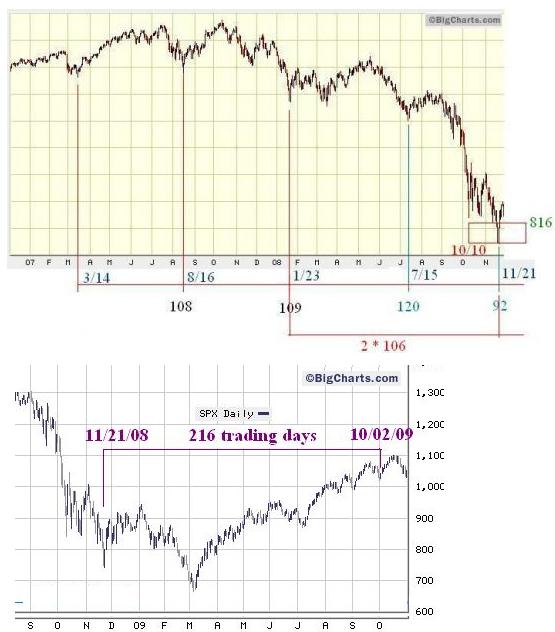
The key dates in October to watch are:
10/04, 10/25 - King Wen's sequence
10/12, 10/28 - Bradley Turn date
10/05, - this is the 108 trading day cycle counting from 05/02
Latest King Wens sequence
Sep 13 2011, 11:44 AM

Sep 16 2011, 07:54 AM

For quite a while I thought King Wens Sequence has limitation on detecting short cycles. My assumption apparently is not true. here is a nice paper for your reference.
Title: The explanation of King Wens order of the 64 hexagrams. link:
http://www.fourpilla...pdf/kingwen.pdf
by D.H.Van den Berghe

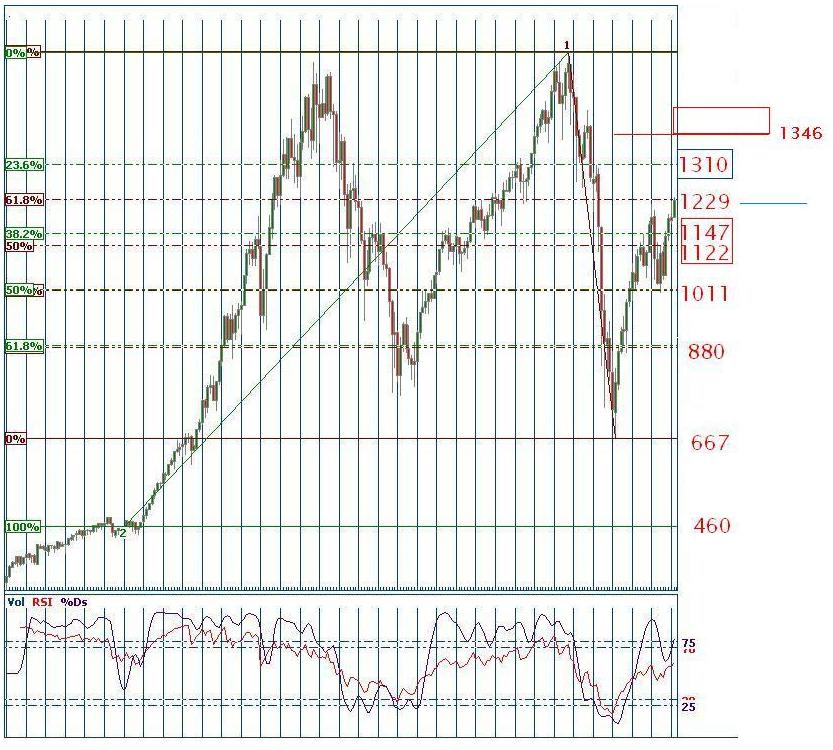
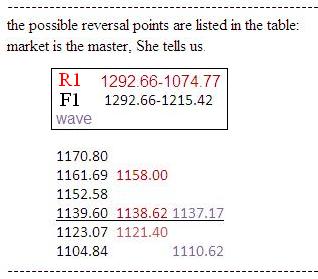
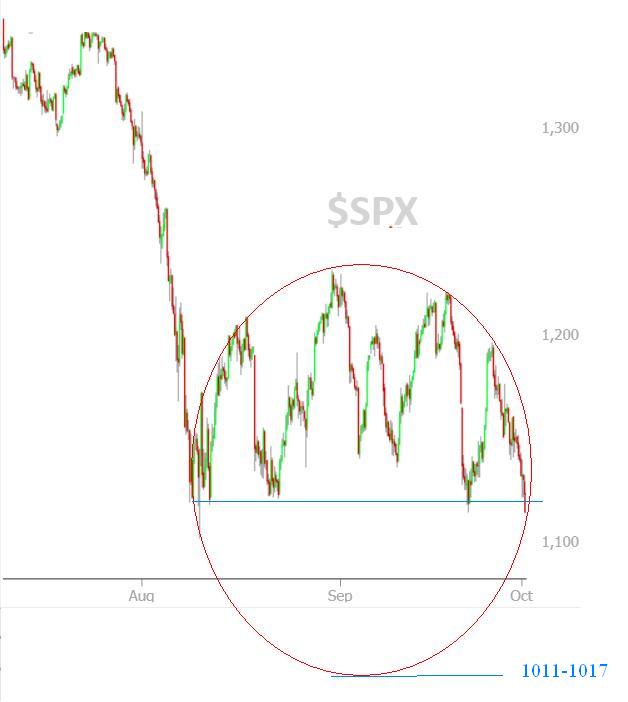
I speculate S&P may hit 1054-1086 before the end of October, even though 1017 cannot be ruled out. (
chart) There is a Fibonacci cluster around 1014 ( somewhere around 1004-1017), we can do fine tuning as index approaching the window. Thereafter, a sizeable counter trend rally to challenge 1229-1236 again.
Dar-Bottom
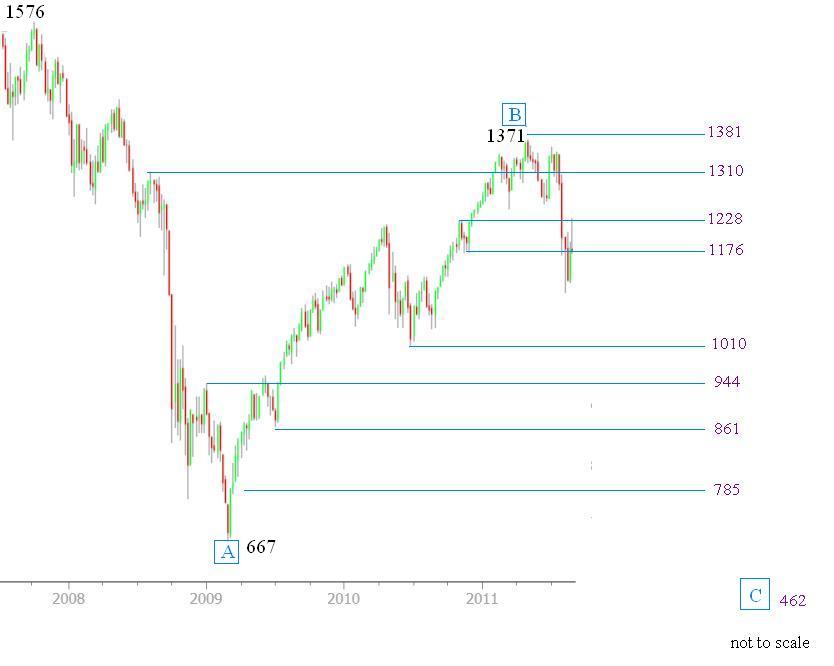
For the long term Dar-bottom, I have a number of 462 (S&P500) which was based on an ideal E-wave structure, since the index did reach 1371, a 0.786 retracement from the all time high/low, so this high retracement put the ideal E-wave structure speculation in some kind doubt.
for an ideal case:
the wave will deploy a wave series in the structure of A-B-C, 5x3x5. If wave C deploys the same wave length as wave A, then, wave C will reach 462 (= 1371 (1576-667)). It is about the averaged number back to year 1993-1994. Time length for the C wave could be 528,591,704 trading days. refer to the chart. Be cautious, the fact that wave B roughly retraced 0.786 (actual 0.774, 0.786@1381) of wave A suggests 5x3x5 might not fit, and there are different forms to deploy.
A 528 trading day from 05/02/2011 ( the day index marked an intraday high 1371) is around June/July 2013.
09/10

Here is another reference:
Title: Prepare for the Global Long Wave Extinction Event
By: David Knox Barker | Saturday, August 20, 2011
http://www.safehaven...xtinction-event
...... The next target in the long wave degrees of freedom radar is 7/28/2013 ....... The final phase of the global long wave collapse will radically change the global financial and political system forever. It will be change for the better. The worst years of this long wave winter season, which lie directly ahead, will provide the impetus and opportunity for global change on a scale heretofore unimagined.
In a Time not Far, Far Away
Mar 5 2011, 08:47 PM
link , posted in IndexCalls, membership required
Part 1: Why should we preserve history?
Part 2: China Ghost Town
Part 3: A spectacular world-wide boom will arrive in our lifetime
The Persian Prince Pirooz

"
Sometime around the year 670, a shining prince-- the son of the last Sassanid King-- arrived in the Tang capital (note). He was there to ask for protection from the Arab invaders who now occupied his country".
http://www.tangdynas...nce-pirooz.html
http://en.wikipedia....Sassanid_Empire
Note: Tang Dynasty June 18, 618 June 1, 907,
http://en.wikipedia....ki/Tang_Dynasty
Three Tangs foreign affairs officials were discussing how to greet the foreign diplomatists, One came from the far side of the Silk road.......
 http://www.history-o...p-of-tang.html#


