Jump to content


Photo

TTheory vs Hurst Cycles


  • Please log in to reply
7 replies to this topic

#1 SilentOne

SilentOne

    Member

  • Traders-Talk User
  • 3,452 posts

Posted 12 July 2010 - 08:35 AM

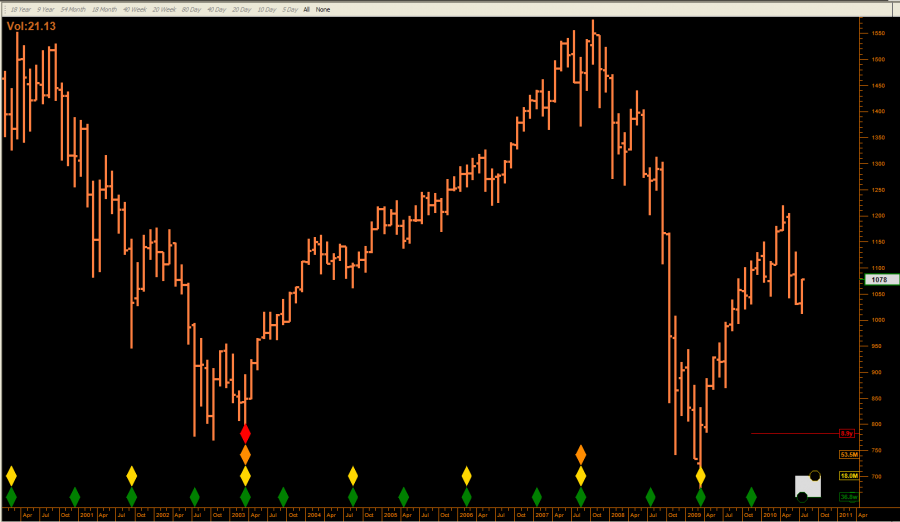
I've followed Terry's musings the last few years and I find he always offers a great perspective on markets, particularly for the long term view. Terry has been eyeing an Aug. 26th high, based on a T construction originally drawn last year. I questioned that timing last year based on a projected 18 month cycle low (80 week) in that timeframe. The nominal Hurst cycle period for the 18 month cycle is due in Aug. The cycle low may come early at 70 weeks (July 1 low), but there is no clear evidence that it has arrived just yet. The 18 month cycle is a very large cycle and one not to ignore. Great trading opportunities can arise from its low, even in bearish markets.

Here's an analysis showing past 18 month (80 week cycle lows). The March 2009 low was the last 18 month low.

http://www.traders-t...rt=#entry437989


Without diving into a full Hurst analysis, the current Hurst cycles status for the $SPX is as follows (this assumes that the 18 month cycle has not bottomed):

9 month pointing down
18 month pointing down
4.5 year pointing down
9 year pointing down
_SPX_10_year_18_month_lows.png


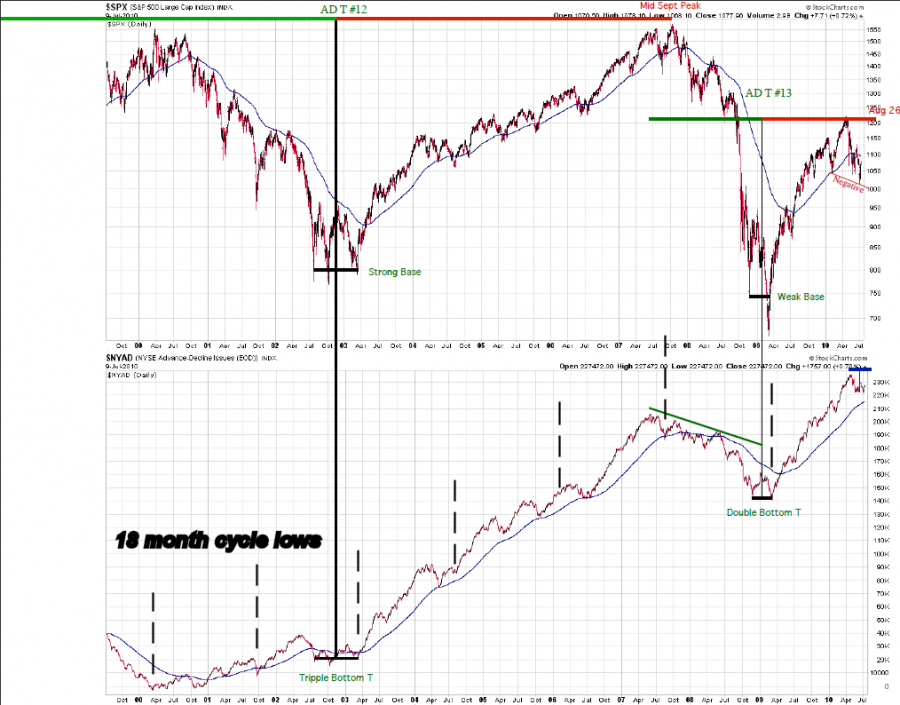
This brings me to Terry's latest T Theory observations. I've taken the liberty to indicate all 18 month cycle lows on this $SPX vs $NYAD chart posted this week. The thing that struck me was how modest the correction appears in terms of the $NYAD plot. All 18 month cycles lows in the last decade were preceeded by a touch or break of the moving average shown. I don't know how this chart was derived. But it appears to me that a significant low is still ahead based on this chart.

cheers,

john

_NYAD10year.png
"By the Law of Periodical Repetition, everything which has happened once must happen again and again and again-and not capriciously, but at regular periods, and each thing in its own period, not another's, and each obeying its own law ..." - Mark Twain

#2 denmo83

denmo83

    Member

  • Traders-Talk User
  • 300 posts

Posted 12 July 2010 - 08:56 AM

Thanks John! Always appreciate your view.

#3 Rogerdodger

Rogerdodger

    Member

  • TT Member*
  • 26,863 posts

Posted 12 July 2010 - 09:26 AM

Nice Hurst work John.
In yesterday's update, Terry sounded very iffy about the potential of much of a rally into late August.
However since his volume oscillator did show the potential, he displayed it.
Often he speculates about "potentials" in the future and some take it that he was bullish.
I think I heard him say: "We don't know."
In another month, the top of his price envelope will be nearer 1120ish.
I believe he has a bearish T followed right behind by a bullish one, followed by a bearish one.
The kind of action you would expect in a weak market.
Get some popcorn and enjoy the movie.
CHART

Edited by Rogerdodger, 12 July 2010 - 09:38 AM.


#4 mogreen

mogreen

    Member

  • Traders-Talk User
  • 686 posts

Posted 12 July 2010 - 09:44 AM

INDU hit 200e at 10217 and I sold my longs. Will start to scale shorts today and Tues mkt... lookin for Friday lows.

#5 NAV

NAV

    Member

  • Traders-Talk User
  • 16,087 posts

Posted 12 July 2010 - 10:04 AM

I believe he has a bearish T followed right behind by a bullish one, followed by a bearish one.

:headspin: :lol:

"It's not the knowing that is difficult, but the doing"


https://twitter.com/Trader_NAV


#6 zoropb

zoropb

    Member

  • Traders-Talk User
  • 8,392 posts

Posted 12 July 2010 - 11:01 AM

I believe he has a bearish T followed right behind by a bullish one, followed by a bearish one.

:headspin: :lol:

Nav why are you laughing? I would say that has high probability :lol: :lol: :lol:


Priceless :lol:


John nice work.

Love, be kind to one another, seek the truth, walk the narrow path between the ying and the yang.


#7 porsche911sg

porsche911sg

    Member

  • Traders-Talk User
  • 2,907 posts

Posted 12 July 2010 - 07:47 PM

INDU hit 200e at 10217 and I sold my longs.
Will start to scale shorts today and Tues mkt... lookin for Friday lows.

What happened to your bp shorts? dont see why its going down
The market catches almost everyone on the wrong side. We always seem to get fake break out before that huge dump or the hugh dump before the false break down! Trade Safe!

#8 Echo

Echo

    Member

  • Traders-Talk User
  • 2,273 posts

Posted 13 July 2010 - 02:30 PM

John, excellent work. The fact that the NYAD cum has not pulled back to its 200ema might be construed as bullish and might be consistent with a rather early 80wk low at 70wks. Time will tell.