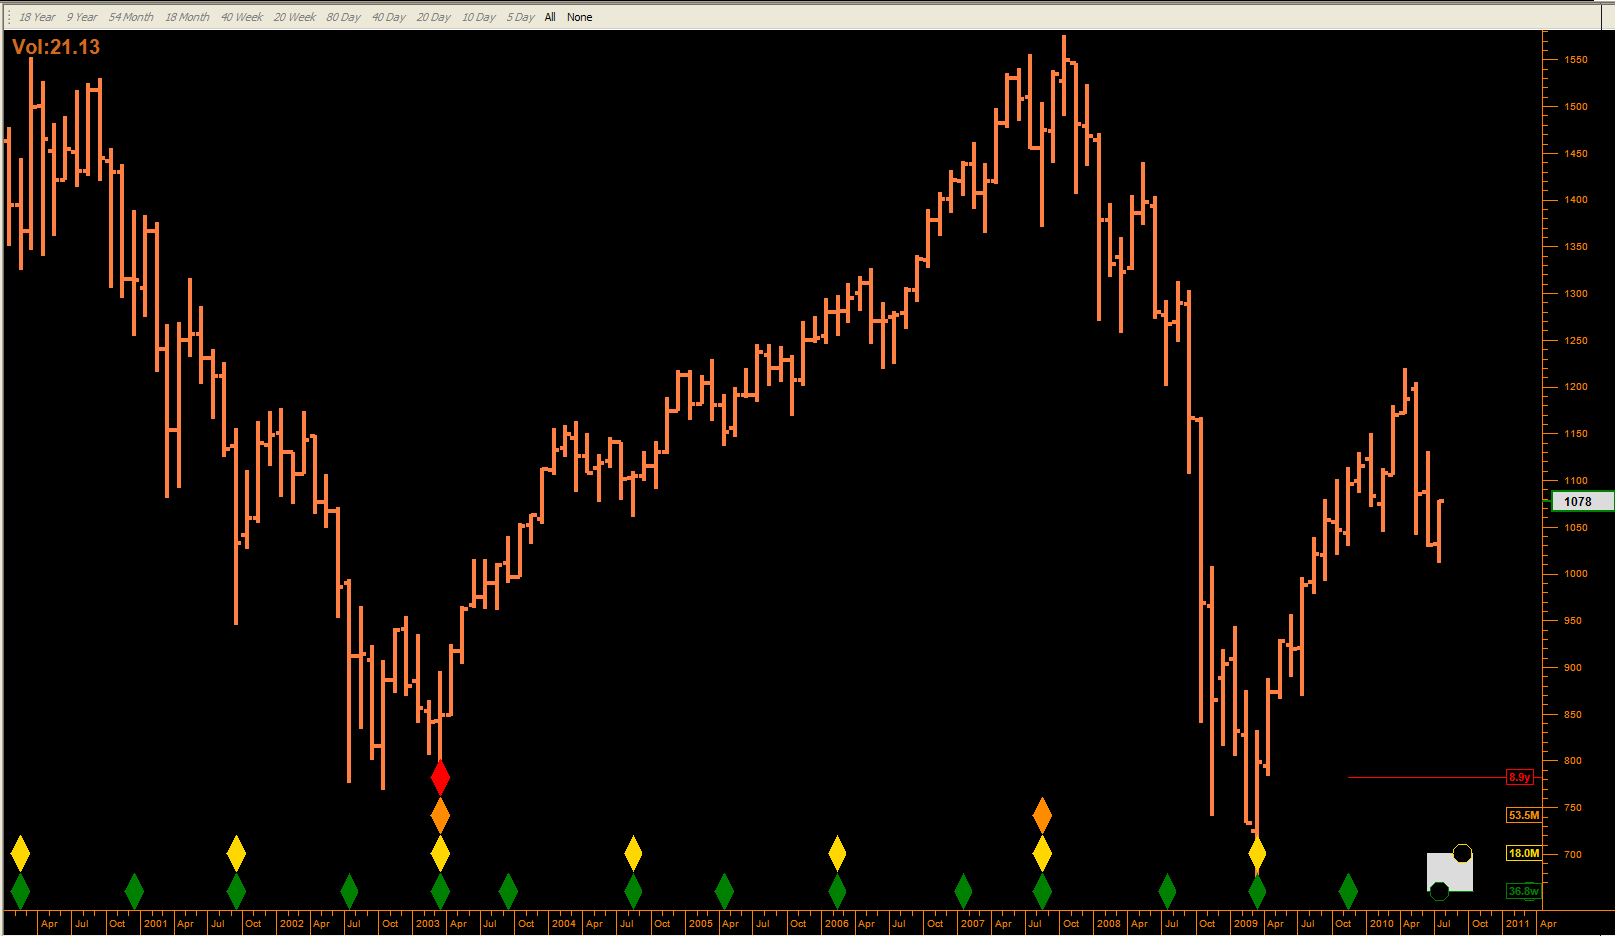
Here's an analysis showing past 18 month (80 week cycle lows). The March 2009 low was the last 18 month low.
http://www.traders-t...rt=#entry437989
Without diving into a full Hurst analysis, the current Hurst cycles status for the $SPX is as follows (this assumes that the 18 month cycle has not bottomed):
9 month pointing down
18 month pointing down
4.5 year pointing down
9 year pointing down
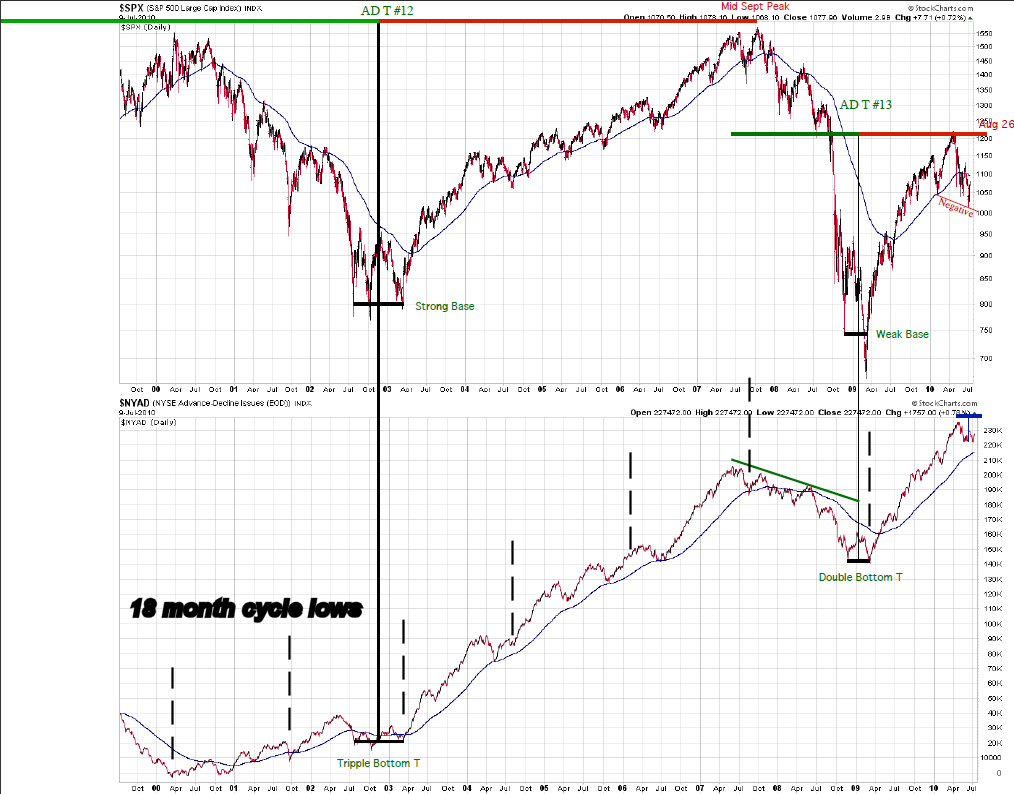
This brings me to Terry's latest T Theory observations. I've taken the liberty to indicate all 18 month cycle lows on this $SPX vs $NYAD chart posted this week. The thing that struck me was how modest the correction appears in terms of the $NYAD plot. All 18 month cycles lows in the last decade were preceeded by a touch or break of the moving average shown. I don't know how this chart was derived. But it appears to me that a significant low is still ahead based on this chart.
cheers,
john