Jump to content


Photo

doing some light buying


  • Please log in to reply
92 replies to this topic

#41 golden

golden

    Member

  • Traders-Talk User
  • 199 posts

Posted 12 November 2010 - 05:45 PM

... and frankly i dont know what the sentiment is-price and time are my guides, sentiment goes to extremes and stays there. take a look @the nasdaq in 99 andn2k.


Oh, I remember it very well.

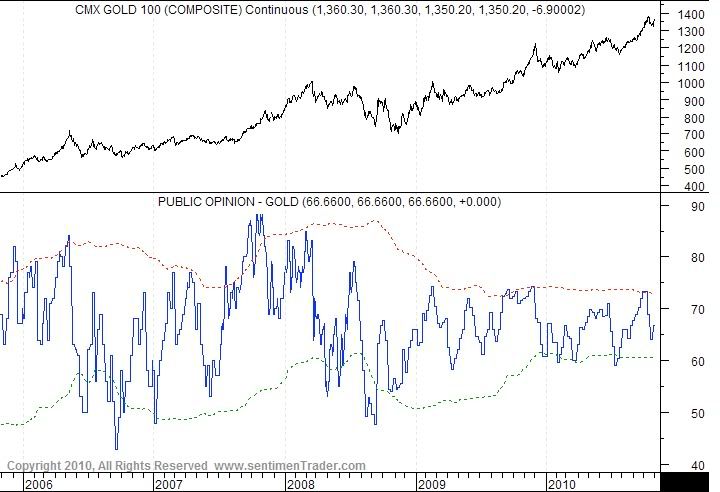
Gold is not even close to the dot-com madness years (1999/2000.)

That's probably several years away.

When gold go parabolic, it should be trading in the 5,000-10,000 range.

Perma-bulls, as well as Perma-bears, only "see" what they want to see......

:D

Enjoy your weekend
"There is only one side of the market and it is not the bull side or the bear side, but the right side."

#42 inamosa

inamosa

    Patterns-based Trader and Investor in ETFs and Futures

  • Traders-Talk User
  • 1,638 posts

Posted 12 November 2010 - 07:22 PM

Just IMHO: This looks like a small and normal daily-type correction to me, so far. Nothing to get excited about - and, indeed, a buying opportunity today, under $1360 especially. Miners held up well today and there appeared to be some accumulation occurring by the big players based on volume flows. If we break $1315, then things may get a bit interesting...but I doubt that happens. As for sentiment, I don't see it as particularly high. Remember, the surprises will mostly come on the upside in a secular bull market.
"Our job is not to predict where the market will go, but to interpret daily price and volume action to ascertain the facts of the current environment and make decisions based on that interpretation."
-Scott O'Neil (son of William O'Neil), Portfolio Manager at O’Neil Data Systems, when asked where the Dow would go in the coming months

#43 golden

golden

    Member

  • Traders-Talk User
  • 199 posts

Posted 12 November 2010 - 07:34 PM

As for sentiment, I don't see it as particularly high.


93% bulls is not particularly high.

What level do you consider sentiment particularly high?


http://stockcharts.com/h-sc/ui?s=$BPG...id=p15746318728

:unsure:
"There is only one side of the market and it is not the bull side or the bear side, but the right side."

#44 JGUITARSLIM

JGUITARSLIM

    Member

  • Traders-Talk User
  • 618 posts

Posted 12 November 2010 - 07:57 PM

Last weeks data, public opinion on Gold was at 67%.
I do not consider this extreme given the run.
There's also been little deterioration in COT data.

Posted Image

#45 inamosa

inamosa

    Patterns-based Trader and Investor in ETFs and Futures

  • Traders-Talk User
  • 1,638 posts

Posted 12 November 2010 - 08:02 PM

As for sentiment, I don't see it as particularly high.


93% bulls is not particularly high.

What level do you consider sentiment particularly high?


http://stockcharts.com/h-sc/ui?s=$BPG...id=p15746318728

:unsure:


The Bullish Percent Index is a mechanical signal based on the number of gold miners on P&F buy signals. It is not a survey of public opinion on gold and/or gold stocks.

From September 2009 to December 2009 gold pushed ahead in spite of a rather high Bullish Percent index, by the way, before climaxing parabolically.
"Our job is not to predict where the market will go, but to interpret daily price and volume action to ascertain the facts of the current environment and make decisions based on that interpretation."
-Scott O'Neil (son of William O'Neil), Portfolio Manager at O’Neil Data Systems, when asked where the Dow would go in the coming months

#46 golden

golden

    Member

  • Traders-Talk User
  • 199 posts

Posted 12 November 2010 - 08:25 PM

The Bullish Percent Index is a mechanical signal based on the number of gold miners on P&F buy signals. It is not a survey of public opinion on gold and/or gold stocks.

From September 2009 to December 2009 gold pushed ahead in spite of a rather high Bullish Percent index, by the way, before climaxing parabolically.


Fair enough, I appreciate your input.

Cheers
"There is only one side of the market and it is not the bull side or the bear side, but the right side."

#47 JGUITARSLIM

JGUITARSLIM

    Member

  • Traders-Talk User
  • 618 posts

Posted 12 November 2010 - 09:42 PM

Updated daily Gold cycle chart.
In timing band for cycle bottom late next week.

Posted Image

Edited by JGUITARSLIM, 12 November 2010 - 09:44 PM.


#48 golden

golden

    Member

  • Traders-Talk User
  • 199 posts

Posted 13 November 2010 - 01:00 AM

Updated daily Gold cycle chart.
In timing band for cycle bottom late next week.

Posted Image


That is one MASSIVE negative RSI & MACD divergence.

:o


Also, your daily timing band appears to be inconsistent.

Please clarify.
"There is only one side of the market and it is not the bull side or the bear side, but the right side."

#49 stubaby

stubaby

    Member

  • Traders-Talk User
  • 1,660 posts

Posted 13 November 2010 - 11:26 AM

Updated daily Gold cycle chart.
In timing band for cycle bottom late next week.

Posted Image


That is one MASSIVE negative RSI & MACD divergence.

:o


Also, your daily timing band appears to be inconsistent.

Please clarify.


golden:

Here is my Alternative Count - helps explain RSI & MACD divergences - if 1,350 breaks - then bottom should be in the 1,290 to 1,321 range.

http://stockcharts.com/c-sc/sc?s=$GOLD&p=D&yr=0&mn=6&dy=0&i=p51464135363&a=205148199&r=1428.png

and the weekly chart does not appear "at risk" as lots of support just below!

http://stockcharts.com/c-sc/sc?s=$GOLD&p=W&yr=3&mn=0&dy=0&i=p92228012366&a=205151058&r=3461.png

stubaby

#50 golden

golden

    Member

  • Traders-Talk User
  • 199 posts

Posted 13 November 2010 - 12:13 PM

golden:

Here is my Alternative Count - helps explain RSI & MACD divergences - if 1,350 breaks - then bottom should be in the 1,290 to 1,321 range.

and the weekly chart does not appear "at risk" as lots of support just below!


stubaby


Excellent charts, stubaby, always appreciate your work.


I suspect that 1350 breaks on Mon/Tues.

1290 to 1320 area is a critical support area, and a failure there,

should lead to a sharp drop down towards your longer-term trend lines.


The Euro, and even more so, the Aussie, breaking down here, will be the key tell.


Cheers.
"There is only one side of the market and it is not the bull side or the bear side, but the right side."