Also, your daily timing band appears to be inconsistent.
Please clarify.
Don't know what you mean by inconsistent?

Member

Posted 13 November 2010 - 12:18 PM
Also, your daily timing band appears to be inconsistent.
Please clarify.
Member

Posted 13 November 2010 - 12:40 PM
Don't know what you mean by inconsistent?
Member
Posted 13 November 2010 - 01:10 PM
Don't know what you mean by inconsistent?
The number of days between your bands differ.
Just trying to understand your timing methodology.
Member
Posted 13 November 2010 - 03:41 PM
no doubt, we are early in the game. 5796 is my #. and i agree w/you we have another 3-4years. it is human nature to see things through ones own eyes.... and frankly i dont know what the sentiment is-price and time are my guides, sentiment goes to extremes and stays there. take a look @the nasdaq in 99 andn2k.
Oh, I remember it very well.
Gold is not even close to the dot-com madness years (1999/2000.)
That's probably several years away.
When gold go parabolic, it should be trading in the 5,000-10,000 range.
Perma-bulls, as well as Perma-bears, only "see" what they want to see......

Enjoy your weekend
Member

Posted 14 November 2010 - 07:31 AM
no doubt, we are early in the game. 5796 is my #. and i agree w/you we have another 3-4years. it is human nature to see things through ones own eyes.... and frankly i dont know what the sentiment is-price and time are my guides, sentiment goes to extremes and stays there. take a look @the nasdaq in 99 andn2k.
Oh, I remember it very well.
Gold is not even close to the dot-com madness years (1999/2000.)
That's probably several years away.
When gold go parabolic, it should be trading in the 5,000-10,000 range.
Perma-bulls, as well as Perma-bears, only "see" what they want to see......
Enjoy your weekend
i use the otc as a reference , most were nt around in 79-80.
gold is in its seasonal strong time of year.
that being said, i see this so far as a normal correction. w/non confirmations @this point in the miners.
the nice thing is this will be resolved soon.
dharma
Member

Posted 14 November 2010 - 11:07 AM
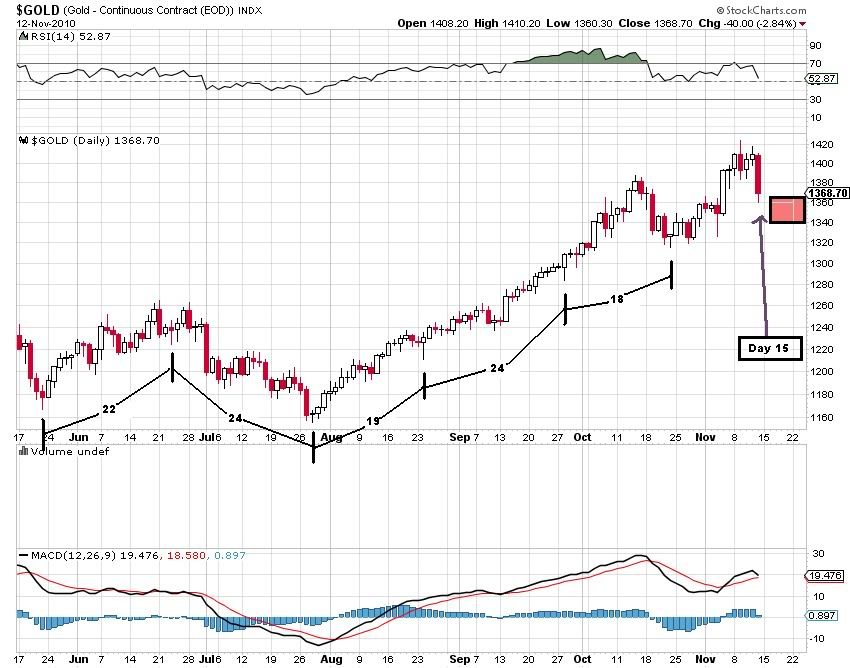
Updated daily Gold cycle chart.
In timing band for cycle bottom late next week.
That is one MASSIVE negative RSI & MACD divergence.

Also, your daily timing band appears to be inconsistent.
Please clarify.
golden:
Here is my Alternative Count - helps explain RSI & MACD divergences - if 1,350 breaks - then bottom should be in the 1,290 to 1,321 range.
http://stockcharts.com/c-sc/sc?s=$GOLD&p=D&yr=0&mn=6&dy=0&i=p51464135363&a=205148199&r=1428.png
and the weekly chart does not appear "at risk" as lots of support just below!
http://stockcharts.com/c-sc/sc?s=$GOLD&p=W&yr=3&mn=0&dy=0&i=p92228012366&a=205151058&r=3461.png
stubaby
Member

Posted 14 November 2010 - 01:28 PM
Updated daily Gold cycle chart.
In timing band for cycle bottom late next week.
That is one MASSIVE negative RSI & MACD divergence.
Also, your daily timing band appears to be inconsistent.
Please clarify.
golden:
Here is my Alternative Count - helps explain RSI & MACD divergences - if 1,350 breaks - then bottom should be in the 1,290 to 1,321 range.
http://stockcharts.com/c-sc/sc?s=$GOLD&p=D&yr=0&mn=6&dy=0&i=p51464135363&a=205148199&r=1428.png
and the weekly chart does not appear "at risk" as lots of support just below!
http://stockcharts.com/c-sc/sc?s=$GOLD&p=W&yr=3&mn=0&dy=0&i=p92228012366&a=205151058&r=3461.png
stubaby
you do realize that your green labeled wave one could just as easily be a massive wave 5 peak? I am not saying it is but it is just and possible IMO, and my cause for caution. Muy malo divergence like have been shown happen in fifth wave very often. Just trying to show both sides fairly.
NO BS
Senor
Member
Posted 14 November 2010 - 02:05 PM
Updated daily Gold cycle chart.
In timing band for cycle bottom late next week.
That is one MASSIVE negative RSI & MACD divergence.
Also, your daily timing band appears to be inconsistent.
Please clarify.
golden:
Here is my Alternative Count - helps explain RSI & MACD divergences - if 1,350 breaks - then bottom should be in the 1,290 to 1,321 range.
http://stockcharts.com/c-sc/sc?s=$GOLD&p=D&yr=0&mn=6&dy=0&i=p51464135363&a=205148199&r=1428.png
and the weekly chart does not appear "at risk" as lots of support just below!
http://stockcharts.com/c-sc/sc?s=$GOLD&p=W&yr=3&mn=0&dy=0&i=p92228012366&a=205151058&r=3461.png
stubaby
you do realize that your green labeled wave one could just as easily be a massive wave 5 peak? I am not saying it is but it is just and possible IMO, and my cause for caution. Muy malo divergence like have been shown happen in fifth wave very often. Just trying to show both sides fairly.
NO BS
Senor
Senor BS:
OK - I agree and we have:
......................Wave 1 (from 1,156)....Wave 1 (from 681)
23.6% FIB...........1,361....................................1,249
38.2% FIB...........1,321....................................1,140
50.0% FIB...........1,290....................................1,053
61.8% FIB...........1,258......................................965
Other Potential Support Areas:
50-Day Moving Average @ 1,326
200-Day Moving Average @ 1,213
15-Week Moving Average @ 1,295
65-Week Moving Average @ 1,162
Trendline (BLUE) from 681 Low @ 1,345
Trendline (RED) across the bottom of Wave from 681 (5 touches) @ 1,265
To me if we started Wave 5 (from 2001) at the 2009 lows:
http://stockcharts.com/c-sc/sc?s=$GOLD&p=M&st=1990-01-01&en=2010-12-31&i=p51308426406&a=188369749&r=2482.png
Then the most likely "worst-case" downside targets here fall in the 1,140 to 1,250 range and would take until around August of 2011.
However, The present wave from the August lows being 5 of 1 of 5 could itself extend into early next year before correcting. That is the question at hand and guideposts are laid out with MA's, FIB's, and trendlines.
We will all be watching this unfold, however, what I believe to be more important at this moment are the earnings and relative performance of the miners verses the metals - to me this is what has recently changed!
stubaby
Member

Posted 14 November 2010 - 05:34 PM
Member
Posted 15 November 2010 - 10:53 AM


