i started out in this biz as a futures trader. i saw 1st hand how leverage wipes folks out. yesterday , @the close they raised silver margins. i say, bring margins to 50% of contracts or have no leverage. then you take away the weak hands, who shouldnt be playing this game anyway.
ok enough of that. 1358 end of this price cycle . and 1341 breaks into the previous cycle. 1325 is the death zone. these are the parameters i am watching. i put on my buying hat today. i have 2 stocks on my list and they have to perform by creating hourly rsi divergences. then i will act. i am 12%on margin in my trading account. in my larger core account , my positions are fully paid for. so , i am lightly on margin.
xau/hui/gdx are forming hourly divergences . its early in the process here. so we cant be sure the divergences will hold . the xau =216.5-213.5 if it holds has created a buy zone for my gann work. hui=555-549 and it is there now. i believe this will be the last bottom before the parabolic. of course there will be a 1 and 2 in elliott terms. but , you get the idea.
dharma
watching the bonds. wheat and soybeans are performing well. nat gas in a bottoming process=its hated oversupply. slowly , very slowly accumulating. in no hurry. yet. its going to take saintly patience. but hey, if you ve nurtured the miners , you know what i mean. just recently, i sold cgr, just before its vertical move, i held that sucker for years as it languished. lost patience and put the money in greener pastures. part of this biz

bottoming
Started by
dharma
, Dec 17 2010 11:22 AM
44 replies to this topic
#2

inamosa
-

- Traders-Talk User
- 1,638 posts
Patterns-based Trader and Investor in ETFs and Futures
Posted 17 December 2010 - 01:48 PM
I can see some names are attracting attention here but I'm still looking for lower gold prices before this correction is over and I go full throttle again. $1265-1300 is the ideal zone for a bottom (or the cycle low for John and JGS), in my opinion. The volume action in the most influential names suggests the correction isn't over yet, also.
But, I do have a core position regardless.
Anything is of course possible here, dharma, so your scenario is certainly one I can respect. As you know we're going to get a massive parabolic up leg in the first or second quarter of next year (I'm looking at Apr/May/Jun and I believe you're looking at Feb for that top) and things get dicey as volatility increases. I look for $1600+ minimally before the top there is made and the n00bs get taken to the woodshed.
Edited by alysomji, 17 December 2010 - 01:55 PM.
"Our job is not to predict where the market will go, but to interpret daily price and volume action to ascertain the facts of the current environment and make decisions based on that interpretation."
-Scott O'Neil (son of William O'Neil), Portfolio Manager at ONeil Data Systems, when asked where the Dow would go in the coming months
-Scott O'Neil (son of William O'Neil), Portfolio Manager at ONeil Data Systems, when asked where the Dow would go in the coming months
#3
dharma
-
- Traders-Talk User
- 9,621 posts
Member
Posted 17 December 2010 - 02:43 PM
[quote name='alysomji' date='Dec 17 2010, 02:48 PM' post='555046']
I can see some names are attracting attention here but I'm still looking for lower gold prices before this correction is over and I go full throttle again. $1265-1300 is the ideal zone for a bottom (or the cycle low for John and JGS), in my opinion. The volume action in the most influential names suggests the correction isn't over yet, also.
But, I do have a core position regardless.
Anything is of course possible here, dharma, so your scenario is certainly one I can respect. As you know we're going to get a massive parabolic up leg in the first or second quarter of next year (I'm looking at Apr/May/Jun and I believe you're looking at Feb for that top) and things get dicey as volatility increases. I look for $1600+ minimally before the top there is made and the n00bs get taken to the woodshed.
[/quote
we have a difference of opinion here. light volume is a characteristic of this time of year. while we could have one more shot, i think that we are very close. and i doubt the lower #s that i mentioned will be seen. quietly supply of physical is disappearing. paper gold is abundant.
dharma
#4
JGUITARSLIM
-

- Traders-Talk User
- 618 posts
Member
Posted 17 December 2010 - 02:55 PM
I can see some names are attracting attention here but I'm still looking for lower gold prices before this correction is over and I go full throttle again. $1265-1300 is the ideal zone for a bottom (or the cycle low for John and JGS), in my opinion. The volume action in the most influential names suggests the correction isn't over yet, also.
But, I do have a core position regardless.
Anything is of course possible here, dharma, so your scenario is certainly one I can respect. As you know we're going to get a massive parabolic up leg in the first or second quarter of next year (I'm looking at Apr/May/Jun and I believe you're looking at Feb for that top) and things get dicey as volatility increases. I look for $1600+ minimally before the top there is made and the n00bs get taken to the woodshed.
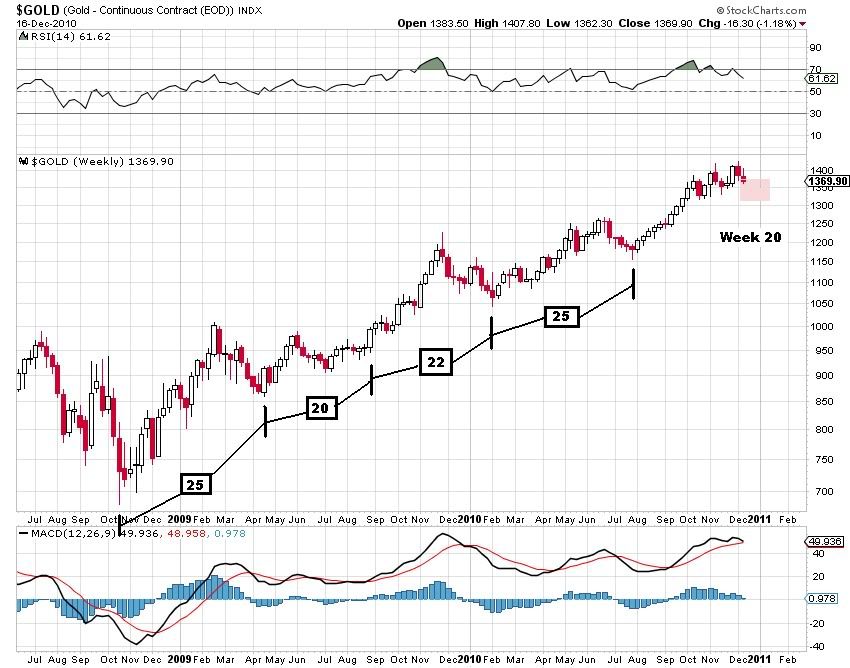
We are on Week 20 of that cycle that typically runs 20-25 wks trough to trough. We are certainly in the timing band for a low.
My expectations were for this cycle to run on the shorter end given the last cycle ran 25 wks. We can certainly drop lower over the next few weeks.
The fact that gold has held up so well given the recent bond collapse and that we've only seen minor weakness this late in the cycle lends me to be believe something very bullish is going on. First sign that we have bottomed is we take out 1408 come next week.
Regardless, i've been buying this weakness. Few to name...CFMSF, TAKUF, TLR
#5
dharma
-
- Traders-Talk User
- 9,621 posts
Member
Posted 17 December 2010 - 03:39 PM
i use xau/hui/gdx on my hourly charts to determine bottoms.
all 3 have divergences
all 3 show the possibility that this decline has ended
frankly the way 1358 has held it indicates to me that the market is well supported
219 started the cycle for xau and it couldnt break back into the previous cycle,217 low 212 previous cycle
also 554 was the death zone for hui and it got to 552 . i am thinking this is over
dharma
#6
uh'sgirl
-

- Traders-Talk User
- 31 posts
Member
Posted 17 December 2010 - 03:49 PM
I agree. I added to my SLW this afternoon simply because the 30 minute chart appears to have found support and should head up.
#7
uh'sgirl
-
- Traders-Talk User
- 31 posts
Member
Posted 17 December 2010 - 04:16 PM
I agree. I added to my SLW this afternoon simply because the 30 minute chart appears to have found support and should head up.
WOW!!!!! Do I feel helpless. In the last 5 minutes of trading, volume on SLW spiked and the price dropped more than $1.00 per share. Does anyone know what happened???
#8
stubaby
-

- Traders-Talk User
- 1,661 posts
Member
Posted 17 December 2010 - 06:00 PM
dharma:
"More than just a feeling!"
From what I see from the individual charts I've looked at - "bottoming" is the correct terminology, but the move out of this bottoming pattern appears to be building explosive potential!
stubaby
#9
johngeorge
-

- TT Member+
- 4,616 posts
Member
Posted 17 December 2010 - 07:03 PM
I agree. I added to my SLW this afternoon simply because the 30 minute chart appears to have found support and should head up.
WOW!!!!! Do I feel helpless. In the last 5 minutes of trading, volume on SLW spiked and the price dropped more than $1.00 per share. Does anyone know what happened???
Could have something to do with options? I dunno, just a guess.

Peace
johngeorge
johngeorge
#10
dharma
-
- Traders-Talk User
- 9,621 posts
Member
Posted 19 December 2010 - 11:13 AM
exactly! the high level consolidation in gold is evidence, but then throw in the miners, where many individual stocks are under accumulation. and you get the makings of an explosive move up. not to mention the projections here. i dont know how many if anyone sees the parabolic shaping up here. but , 10years later than sinclair, i see it. its going to surprise alot of folks.dharma:
"More than just a feeling!"
From what I see from the individual charts I've looked at - "bottoming" is the correct terminology, but the move out of this bottoming pattern appears to be building explosive potential!
stubaby
folks will be buying this on the fly, only to be taken behind the woodshed on the correction following the parabolic.
dharma
that chart of tre that you put up is evidence. its a large base.


