Jump to content


Photo

SPX thoughts


  • Please log in to reply
363 replies to this topic

#331 tsharp

tsharp

    Member

  • Traders-Talk User
  • 1,487 posts

Posted 30 April 2018 - 03:49 PM

On my insta account, I posited over the weekend that it seemed the upward move of late last week was a c-wave and it would soon peak, to resume the IT downtrend... that appears to have come to fruition and I suspect price will soon be at or below the UTL before a substantial bounce materializes... but as always... time will tell.


SP00_240_4.30.18.jpg


Link to chart:  https://postimg.cc/image/5ujwhy6d5/


#332 tsharp

tsharp

    Member

  • Traders-Talk User
  • 1,487 posts

Posted 02 May 2018 - 03:50 PM

No change in my thoughts on the SPX... though I note that the pinkish UTL has been hit four previous times but today it was closed below, so it appears the next lower orange-ish UTL is the next target... time will tell.


SP00_240_5.2.18.jpg


Link to chart:  https://postimg.cc/image/nqibwoyjt/


#333 tsharp

tsharp

    Member

  • Traders-Talk User
  • 1,487 posts

Posted 05 May 2018 - 01:33 PM

With the rally on Thursday and into Friday's close, I had to reconsider the the SPX was taking an alternate road map in this correction, and that a contracting triangle is what will actually play out at this point.  It is interesting to note that the low for wave-e is 2594.62, and my first target for the corrective low was 2591.67; this also is a consideration in my change of fractal count.


In the hourly SPX chart, you will notice the momentum indicator line rallied up to the green TL, then paused.  There may be a pullback on Monday, but I suspect wave-e:iv may be complete at this time... if not, then wave-b:e:iv is complete and there is one final leg down (wave-c) to complete... then the correction is complete and the march back upward to new ATHs will commence.  WIth fractal theory, there are always alternate counts, but for now, this becomes my favored count until it's invalidated.


SPX_60_5.4.18.jpg


Link to SPX 60-min chart:  https://postimg.cc/image/oka3gt0ft/


Looking at the daily charts, both the fast and slow momentum charts appear to be in a position that they could simply rise from here... we shall see!


SPX_D_5.4.18-1.jpg


Link to SPX daily fast momentum chart:  https://postimg.cc/image/7jr785i9l/


SPX_D_5.4.18-2.jpg


Link to SPX daily slow momentum chart:  https://postimg.cc/image/aducljfa1/


Regarding the SPX weekly fast and slow momentum charts, they're both still in a definitely LT bullish configuration and could simply push back upward from where they are.


SPX_W_5.4.18-1.jpg


Link to SPX weekly fast momentum chart:  https://postimg.cc/image/l9h53bill/


SPX_W_5.4.18-2.jpg


Link to SPX weekly slow momentum chart:  https://postimg.cc/image/wltql3bux/


Moving on the the monthly charts... I put in the SPX monthy ATR with a fast momentum indicator line; I think I've posted it a time or two in the past... it shows the indicator line still clearly in a bullish configuration, but please note that it has not even been able to break through the DTL from its ATH going back over twenty years, but has twice respected it and turned away... this rally appears to be on borrowed time.  Note also the ATR is still sitting at ~2633 on a closing basis for the month of May... I do not see it being elected this month.


SPX_M-_ATR_5.4.18.jpg


Link to SPX monthly fast momentum chart with ATR:  https://postimg.cc/image/l0o5qxkuh/


Finally, and last, but not least, an update on my SPX projection chart from 4.9.16... I suppose it seems fitting that a bullish pennant formation at about the halfway point is the set-up for the next phase of this bull market run that I think will take the SPX upward to the ~3600 range... but as always... time will tell!


SPX_W-_EW_Projection_5.4.18.jpg


Link to SPX EW projection chart:  https://postimg.cc/image/c1owmlgo9/


#334 tsharp

tsharp

    Member

  • Traders-Talk User
  • 1,487 posts

Posted 13 May 2018 - 11:34 AM

From my post on FF earlier this weekend...


The hourly SPX chart seems to clearly state the intent of the US markets...


A fractal wave pattern particular to the wave-iv position - a (3-3-3-3-3) contracting triangle...


Completion of the wave-e:iv within three SPX points of my first target published on 3.11.18 - ~2592 V ~2595...


Coming up through the green DTL on the indicator chart, back-testing it, then launching upward from there...


And last, but not least, the price gapping upward through through the DTL of the upper triangle channel...


IMHO, all this points to the wave-iv completion and the commencing of wave-v, with an upward target of ~3600, basis the SPX... as always... time will tell.


SPX_60_5.11.18.jpg


Link to chart:  https://postimg.cc/image/lr7qswiex/


FWIW, my projection for ~3600 SPX had nothing to do with the contracting triangle... that only settled the wave-iv matter.  My projection for ~3600 was from my fractal road map first published on 4.9.16:


SPX_W_EW_4.9.16_-_Alt.jpg


Chart link:  https://postimg.cc/image/h1w1snruh/


Here's the same chart with the overlay as of last Friday:


SPX_W-_EW_Projection_5.11.18.jpg


Link to chart:  https://postimg.cc/image/4ahvmbaeh/


#335 tsharp

tsharp

    Member

  • Traders-Talk User
  • 1,487 posts

Posted 19 May 2018 - 08:09 PM

I'll be starting this week with the RUT 2000... most of the time, the small caps lead the broader market, and with the RUT moving back to new ATHs, it seems to make the case for my wave-iv label in the SPX and that the bull market is still in tact.


RUT_W_5.4.18-2.jpg


Link to chart:  https://postimg.cc/image/ajfm5d1rt/


Pivoting now to the SPX... the 60-min chart shows my preferred fractal count at this time.  Last week, I suggested the possibility for two different fractal counts off the wave-e:iv low, and now I am back to only one count, with a smaller wave-i, wave-ii, with wave-ii in progress, in what seems to be a c-wave EDT, with wave-c or wave-d in progress.  I would guess a couple more days of downward bias next week, then back upward in a smaller wave-iii.


SPX_60_5.18.18.jpg


Link to chart:  https://postimg.cc/image/vt38gapt5/


The SPX daily fast and slow momentum charts show normal behavior relative to where their respect indicator lines presently are.  The fast chart is churning at the zero line and since it's coming from below the zero line, it's most likely to break upward.  The slow momentum chart shows the indicator line coming into the confluence of latent TLs, bouncing off, then coming back into them again... the next time should be a break-through to the upside... time will tell.


SPX_D_5.18.18-1.jpg


Link to chart:  https://postimg.cc/image/axgy57tnt/


SPX_D_5.18.18-2.jpg


Link to chart:  https://postimg.cc/image/470gvylzd/


The SPX weekly fast chart shows the indicator line also dancing around between latent UTLs, and should soon break upward... and as long as the indicator line remains within the last bubble, the bull market remains in tact.  You'll also note that the slow indicator line is dancing between latent TLs, in a bullish configuration above the +100 line.


SPX_W_5.18.18-1.jpg


Link to chart:  https://postimg.cc/image/wl5wfu1tl/


SPX_W_5.18.18-2.jpg


Link to chart:  https://postimg.cc/image/f7vm0te6h/


Have a great weekend! 


FWIW, I will be posting an update to the GC chart over on the gold thread later on.


#336 tsharp

tsharp

    Member

  • Traders-Talk User
  • 1,487 posts

Posted 28 May 2018 - 01:20 PM

Hi all,


First off, I want to encourage everyone in the US who reads this to please take a moment sometime today to stop... remember... consider... how we still enjoy freedom today are still one of the most blessed nations on earth, in large part because of the ultimate sacrifice made by those who defended our nation.


Thank you to all the fallen service men and women, and their families, for your sacrifices to help keep us free!


T. Sharp, Sgt. USAF, 1981-1985


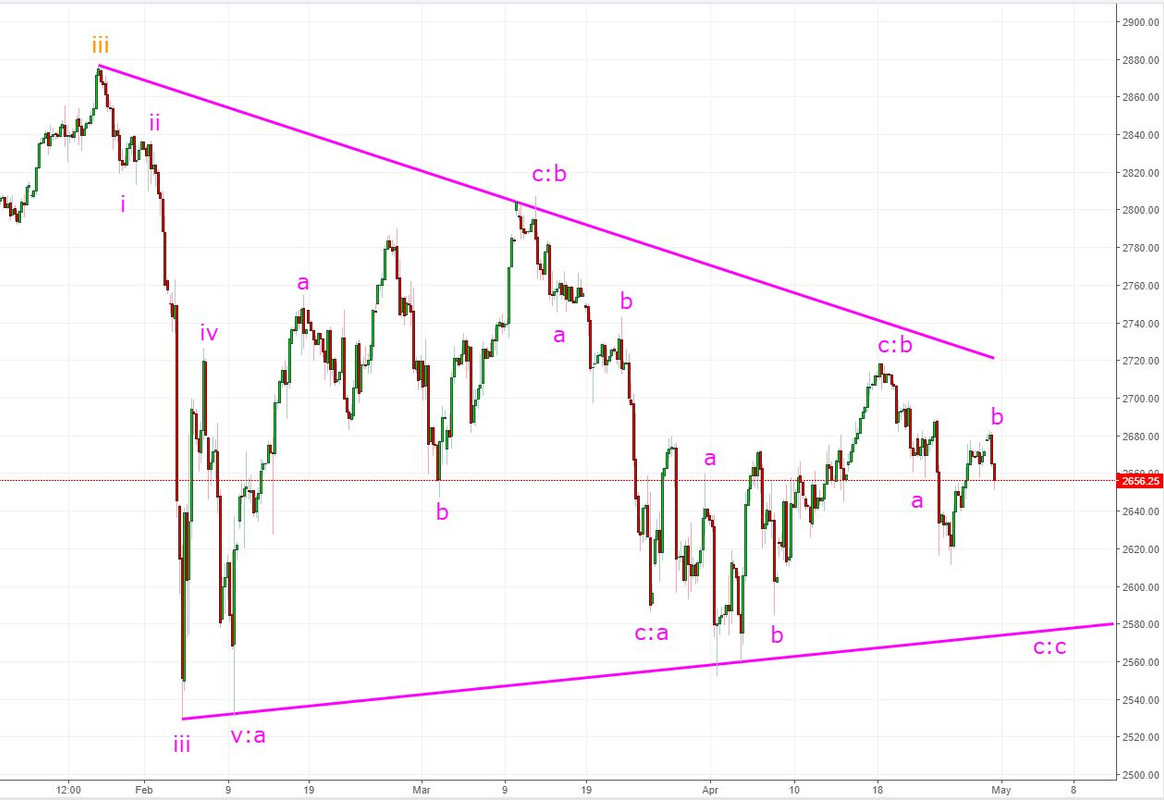
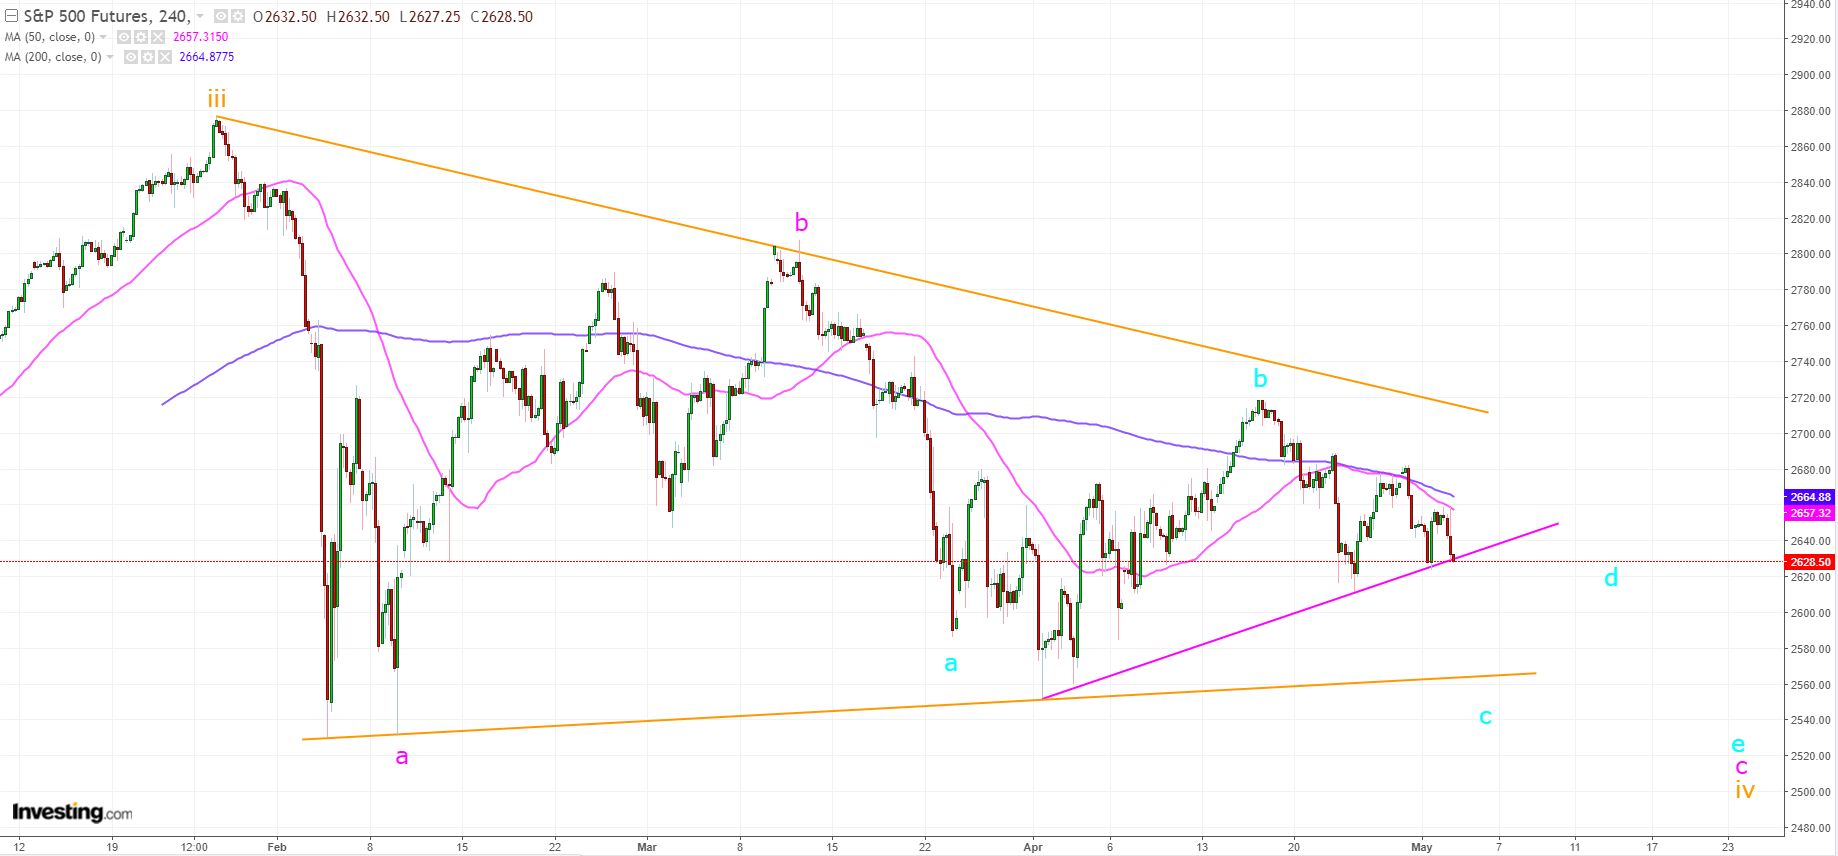
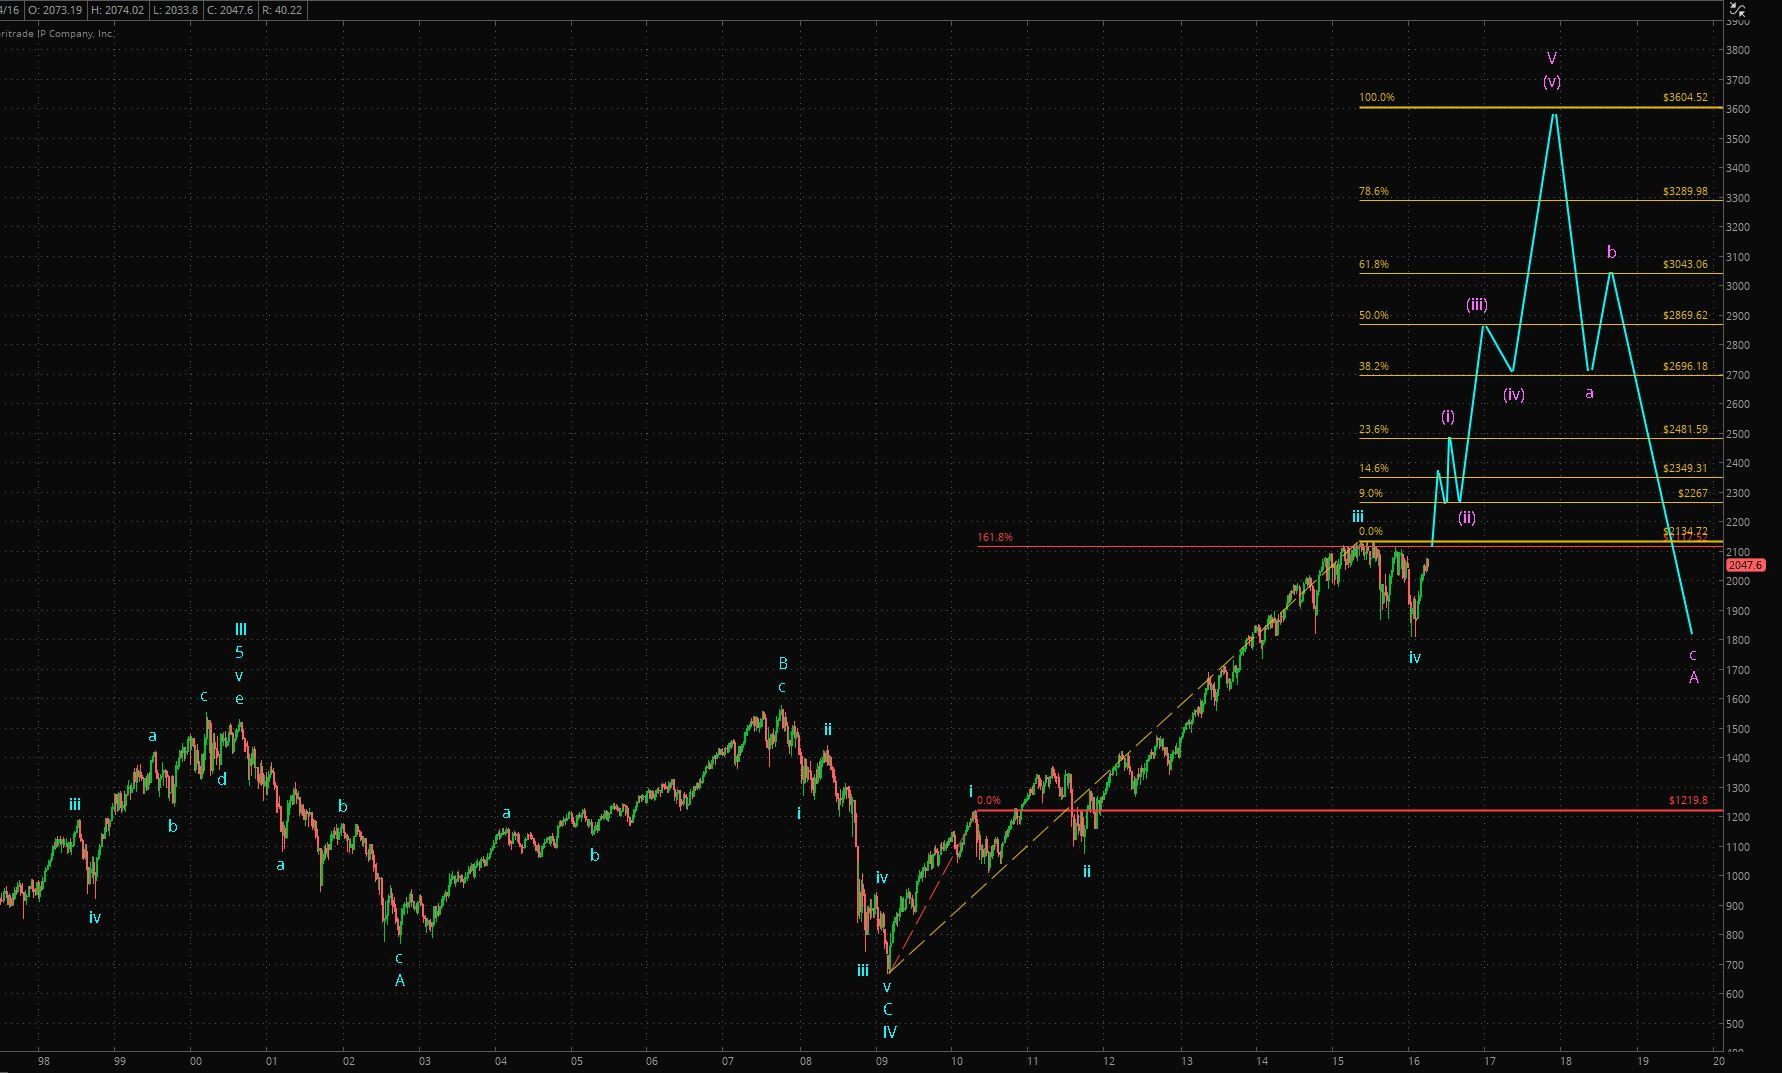
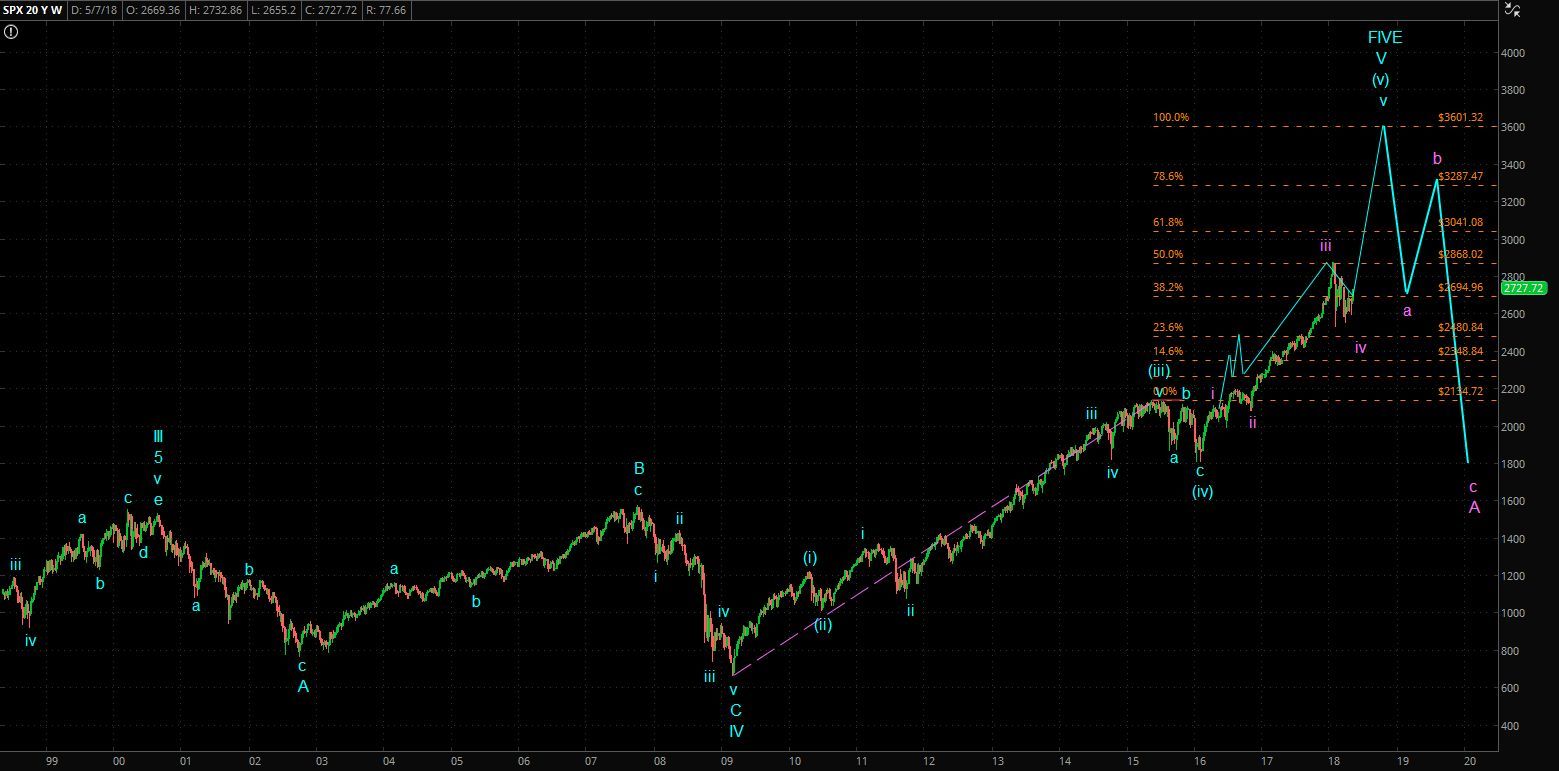
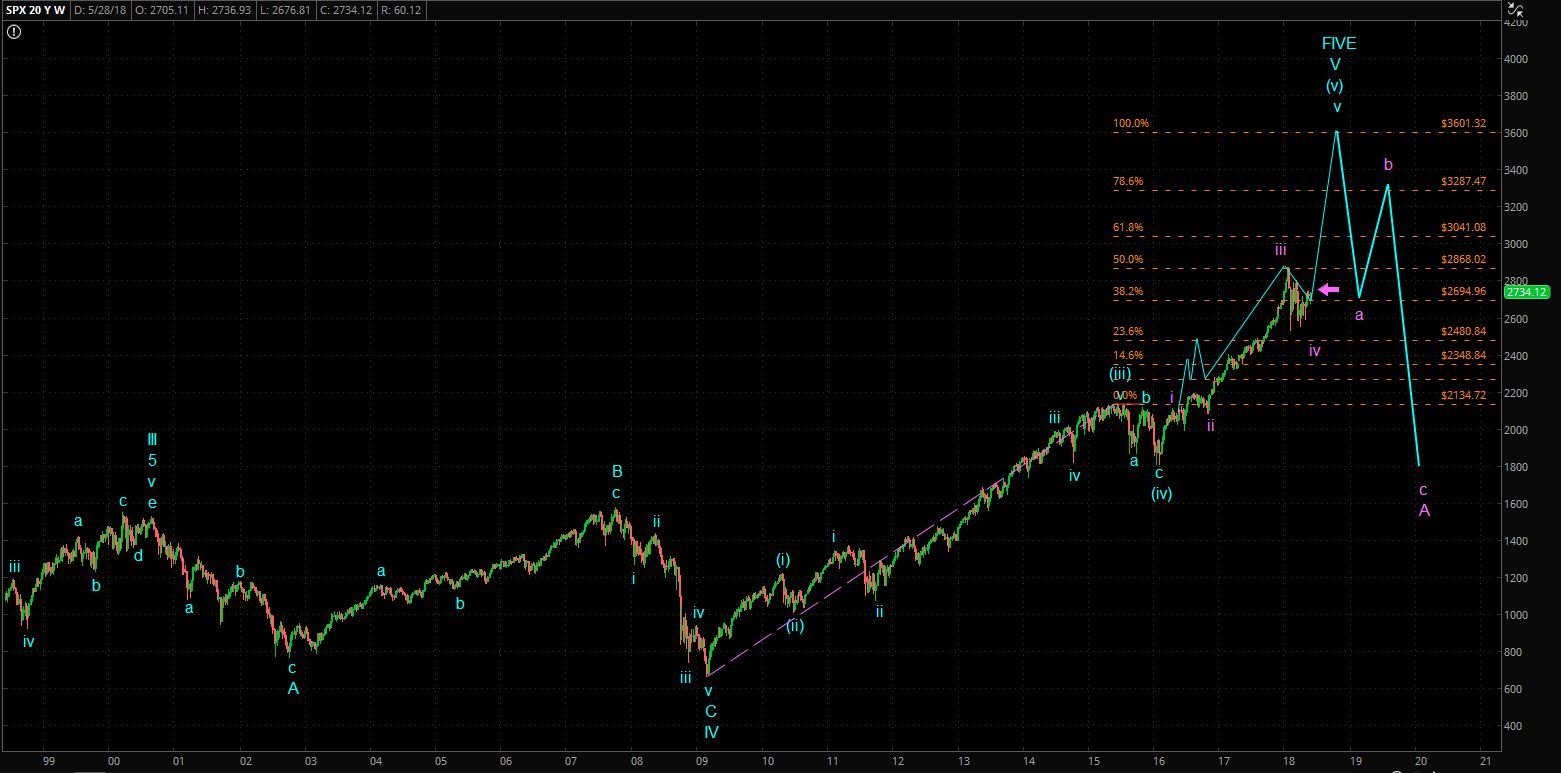
It appears to me that the SPX left last week ready to break upward from the flag/coil formation off the wave-e:iv, with a wave-i, wave-ii completed or nearly so, and methinks the next IT target will be in the SPX ~3000 range for wave-iii.


SPX_60_5.25.18.jpg


Link to SPX hourly chart:  https://postimg.cc/image/fv0jdghe1/


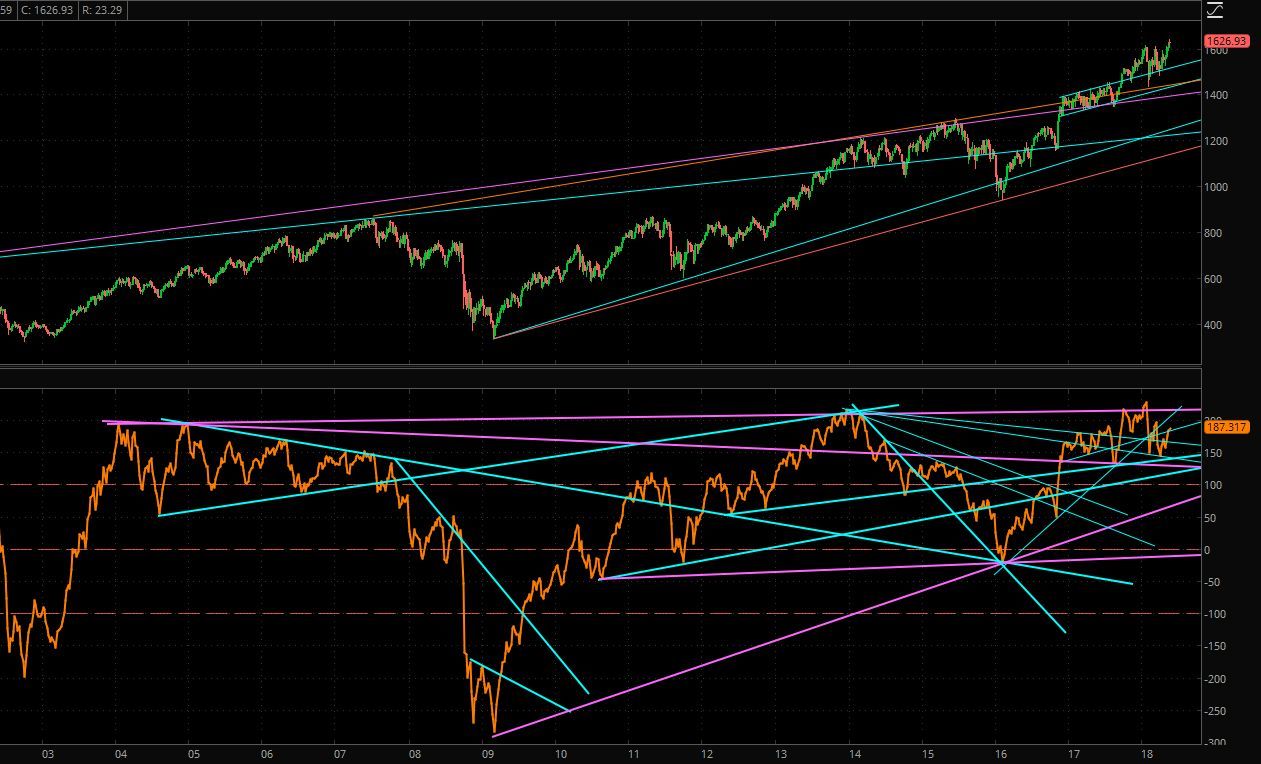
Other charts I've posted this week include the weekly slow momentum Dow Jones Transports index, which while it has not yet pushed to new ATHs, it does show confirmation with the indicator for each time a new high in price was reached since the low in 2016... I suspect this time a negative divergence will be the case, marking the end of the bull market for now.  Note also how that the RH&S I noted nearly two years ago, played out nicely.


DJT_W_5.25.18-2.jpg


Link to DJT chart:  https://postimg.cc/image/my8et2ujd/


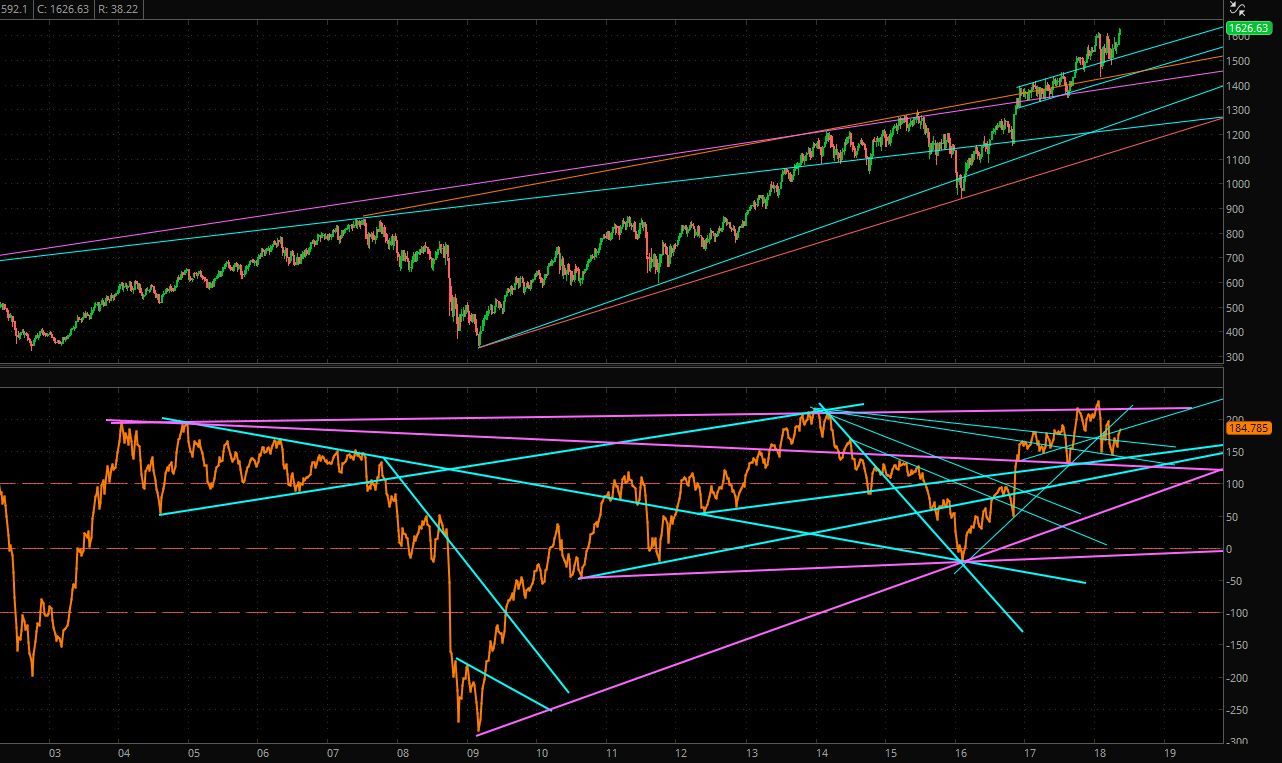
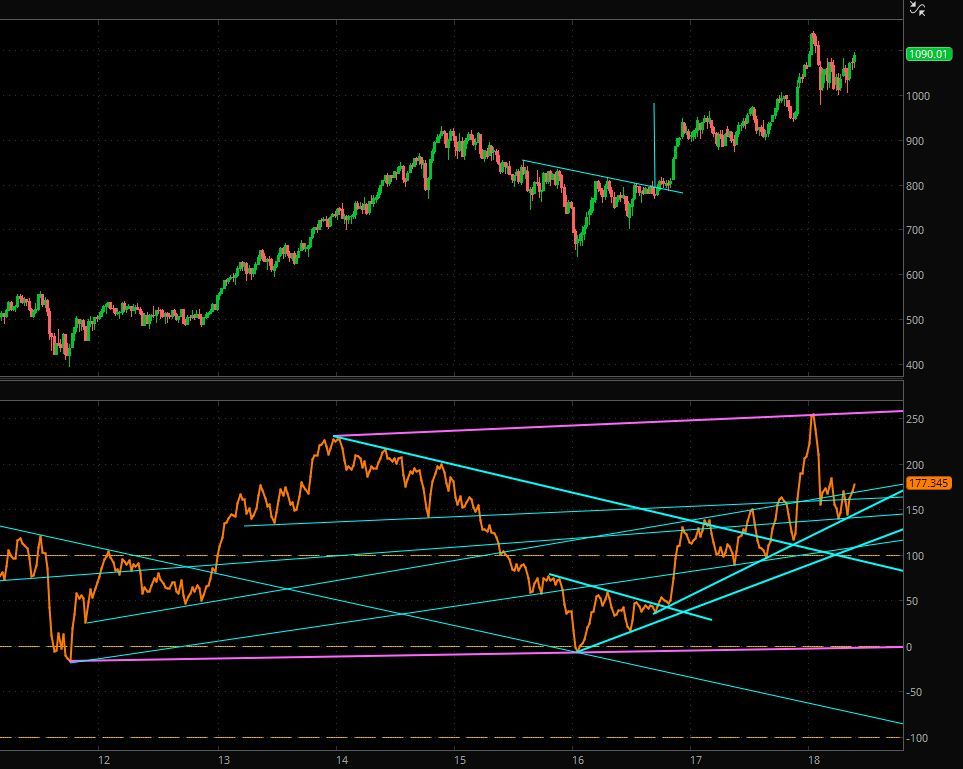
Next, I'm posting the weekly slow moment RUT chart, which I suggest is leading the market higher, as it completed its contracting triangle first, broke out and back-tested the same and pushed upward to new ATHs... showing us that the broader market is about to do the same.  Note also that each new successive high in price since 2003 was also confirmed by a new high in the momentum indicator AND that with the last new ATH, the indicator also marked a new ATH.


RUT_W_5.25.18-2.jpg


Link to RUT weekly chart:  https://postimg.cc/image/45wjpl5vt/


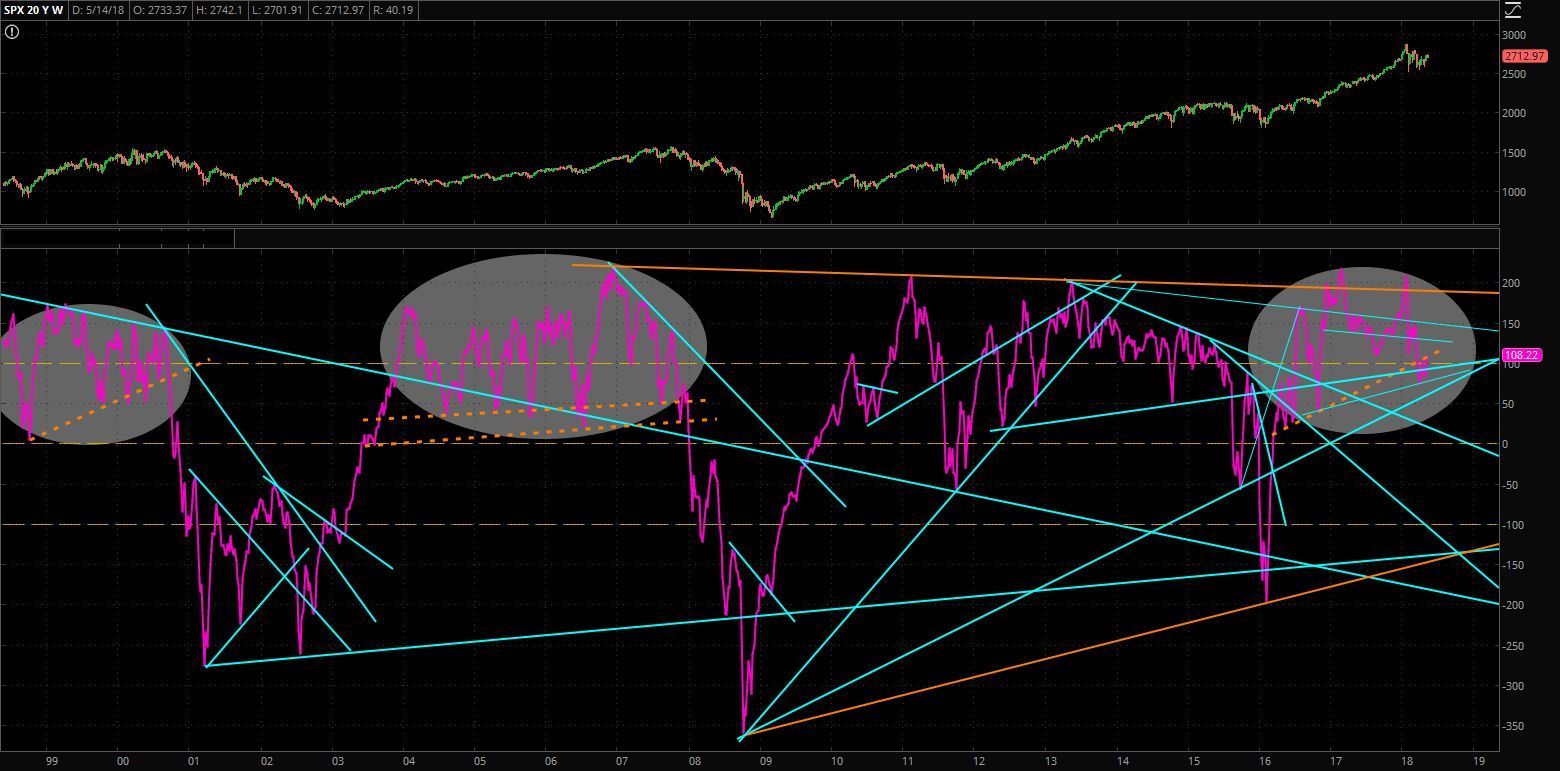
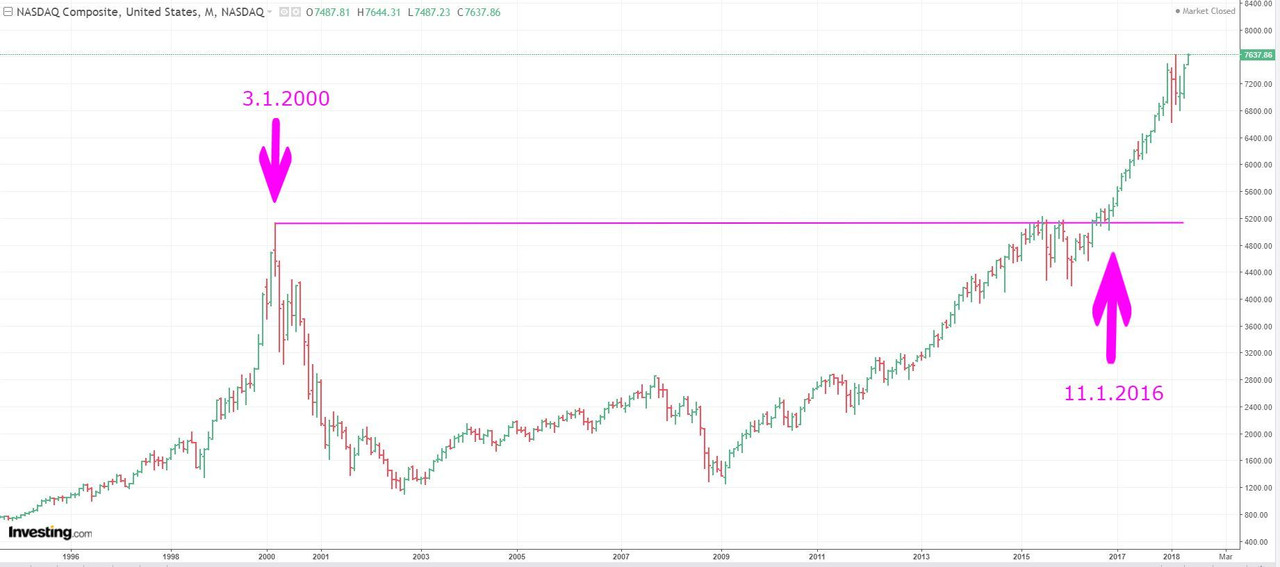
And finally, the weekly slow momentum COMP chart shows the same, with new highs in price confirmed by the same in the in indicator since the 2003 lows, except that the ATH in momentum still remains at the price high in 2000... that's quite a bit higher from today's mark, so I lean towards the divergence remaining against the 2000 price ATHs... we shall see.


COMP_W_5.25.18-2.jpg


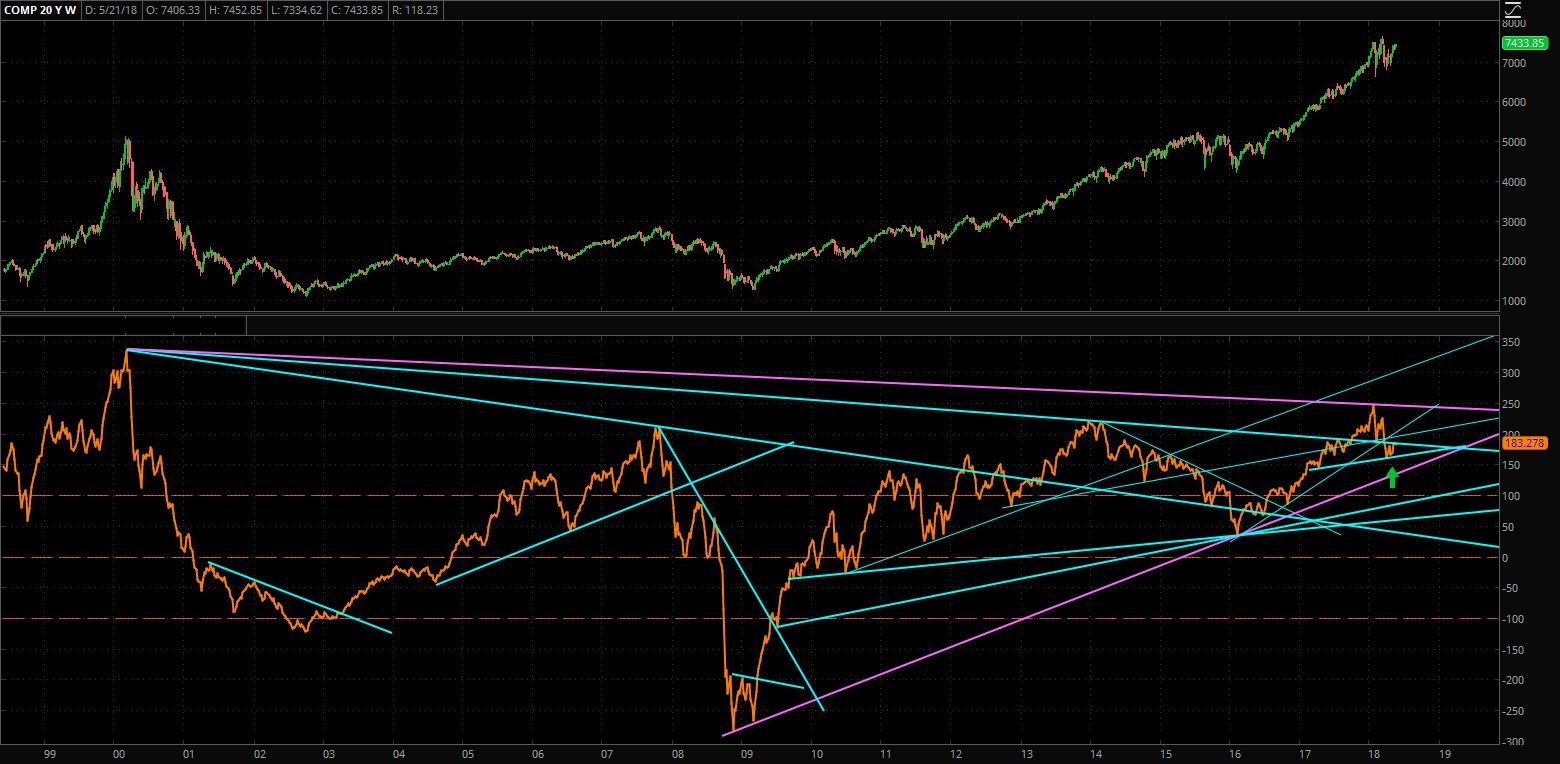
Link to COMP weekly chart:  https://postimg.cc/image/jemh3dmpl/


#337 tsharp

tsharp

    Member

  • Traders-Talk User
  • 1,487 posts

Posted 01 June 2018 - 08:23 PM

Okay then... with today's upward thrust through the neckline, I my fractal count is wave-i, wave-ii, wave-i, wave-ii, and are moving upward in a wave-iii, with a goal in the ~3000 range before an IT pause... time will tell.


SPX_60_6.1.18_1.jpg


Link to 60-min chart:  https://postimg.cc/image/mbzqfiqsp/


Regarding where what the 4.9.16 published road map looks like versus what has transpired, the fuchsia arrow marks the where we are near today's close and with wave-iv complete, the last leg of this bull market is underway with a completion goal of ~3600 over the coming months... time will tell.


Projection chart from 4.9.16:


SPX_W_EW_4.9.16_-_Alt.jpg


Link to chart here:  https://s20.postimg.....9.16_-_Alt.jpg


Actual SPX path as of today:  


SPX_W-_EW_Projection_6.1.18_1.jpg


Link to chart:  https://postimg.cc/image/60zmj3r4p/


Great weekend to all!


#338 mss

mss

    I'M WATCHING

  • TT Sponsor
  • 6,182 posts

Posted 02 June 2018 - 11:14 AM

Great post ! As always I generally agree with you, sometimes timing differs. We may also be in a short term "fish hook" position. My old-timers chartcat.gif


The upside and timing is fast becoming a hard thing to nail down. But we have to try.


Best to you,


msscat.gif


WOMEN & CATS WILL DO AS THEY PLEASE, AND MEN & DOGS SHOULD GET USED TO THE IDEA.
A DOG ALWAYS OFFERS UNCONDITIONAL LOVE. CATS HAVE TO THINK ABOUT IT!!

#339 tsharp

tsharp

    Member

  • Traders-Talk User
  • 1,487 posts

Posted 06 June 2018 - 05:49 PM

Hi all,


The SPX seems to be cooperating with my fractal views... for the moment, at least.  I'm posting the SPX hourly, and the fast and slow daily charts.


The hourly shows an island reversal and several break-away gaps, with all three charts showing the momentum indicators in the uptrend range.  Note on both of the daily charts how the momentum indicator has broken out of each of the respective bubbles to the upside... though note that at least two of the indicators are running into latent TLs, so there may be an ST pause coming shortly... time will tell.


Cheers!


SPX_60_6.6.18.jpg


Link to chart:  https://postimg.cc/image/gl2nz7r0p/


SPX_D_6.6.18-1.jpg


Link to chart:  https://postimg.cc/image/58q2hqfuh/


SPX_D_6.6.18-2.jpg


Link to chart:  https://postimg.cc/image/8435o4ma1/


#340 tsharp

tsharp

    Member

  • Traders-Talk User
  • 1,487 posts

Posted 11 June 2018 - 07:32 PM

From something I posted over the weekend:


BIT_W_6.5.18.jpg


Link to chart:  https://postimg.cc/image/h8r58sprb/


Parabolic markets - when an issue, indice or commodity goes parabolic in price... historically, they crash and take a very long time to recover.


Gold went parabolic in the 80s and took 28-years to recover...


GOLD_M_6.5.18.jpg


Link to chart:  https://postimg.cc/image/4veb1dzxj/


The Nikkei 225 went parabolic in the 90s and still has not yet recovered...


JP225_M_6.5.18.jpg


Link to chart:  https://postimg.cc/image/oq0cnkkav/


The NASDAQ Composite went parabolic in the 2000s and took 16-years to recover...


COMP_M_6.5.18-2.jpg


Link to chart:  https://postimg.cc/image/cbdknbddz/


BIT went parabolic this year, and IMHO, based on my fractal interpretation and momentum indicator, has not yet bottomed, and if history is any indication, will not recover for 10-20 years....


Time will tell.