Jump to content


Photo

SPX thoughts


  • Please log in to reply
363 replies to this topic

#351 tsharp

tsharp

    Member

  • Traders-Talk User
  • 1,487 posts

Posted 06 April 2019 - 01:37 PM

SPX-W-4-5-19-1.jpg


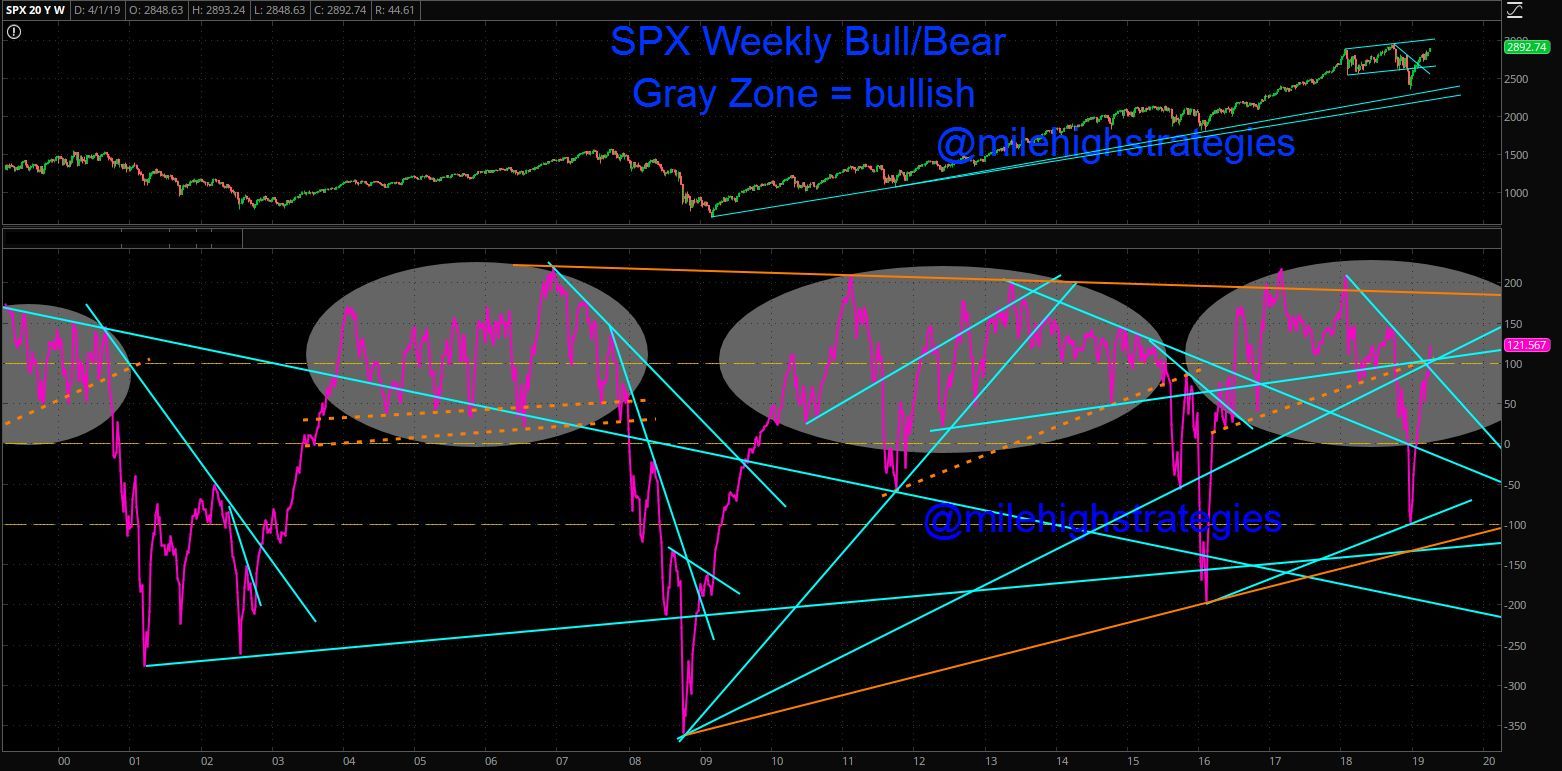
This is a bit of a detailed update to one of my specialty charts that filters bull market conditions from bear market conditions...

In my SPX forecast made on 4.9.16 (more about this below), I called for the SPX to remain in a bull market through 2021, so was a bit surprised with the heavier weakness in US equities in November and December of 2018...


Of all the economies in the world, the US economy is one of the strongest and most resilient, so rather than denying what was happening for all the world to see, I had to dig deeper for understanding...

  • I absolutely was expecting Europe to move into economic recession, and the same was true for Asia (and still is for both economies)...
  • The +25-year bear market in the US dollar had ended years ago, and a new bear market in bonds was just beginning (both still true)...
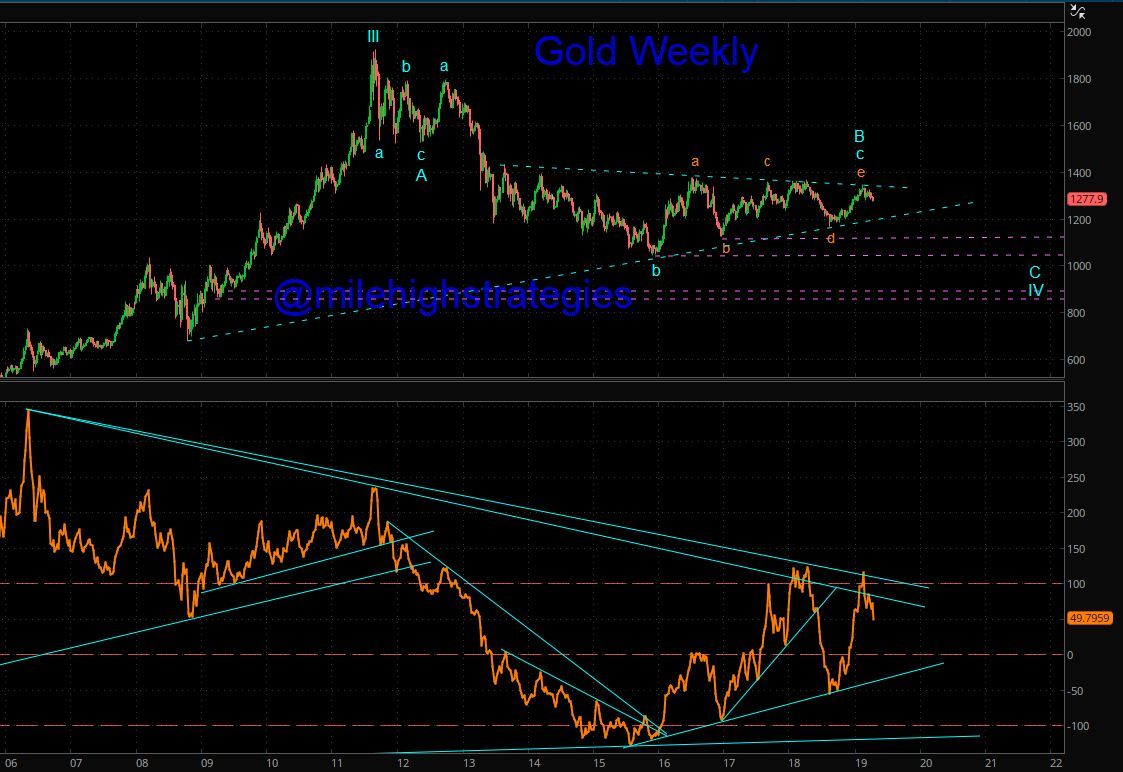
  • The bear market in gold had not yet completed and while oil was in a corrective state, its long-term bull market still had an appointment with new ATHs (both still true)... so the relative weakness in US equities was not making any sense until the incredible market breadth and rally in the early weeks of 2019 helped present the new narrative for US equities...


All those other factors remained true, AND the momentum indicator line on the SPX quickly moved back within the gray bubble zone - so the bull market in US equities was still in tact, though a reset in momentum was needed to EXTEND the time frame for this great bull market in the US equity markets beyond 2021...


Long introduction, I know, but context is needed from time to time... this week the momentum indicator line has extended its push upward past the confluence of the TLs (chart above), and its next higher target remains the long-term DTL... watching. 


CONTEXT - I mentioned a few things in my earlier post today (combining two posts here) that probably should also be put into context...


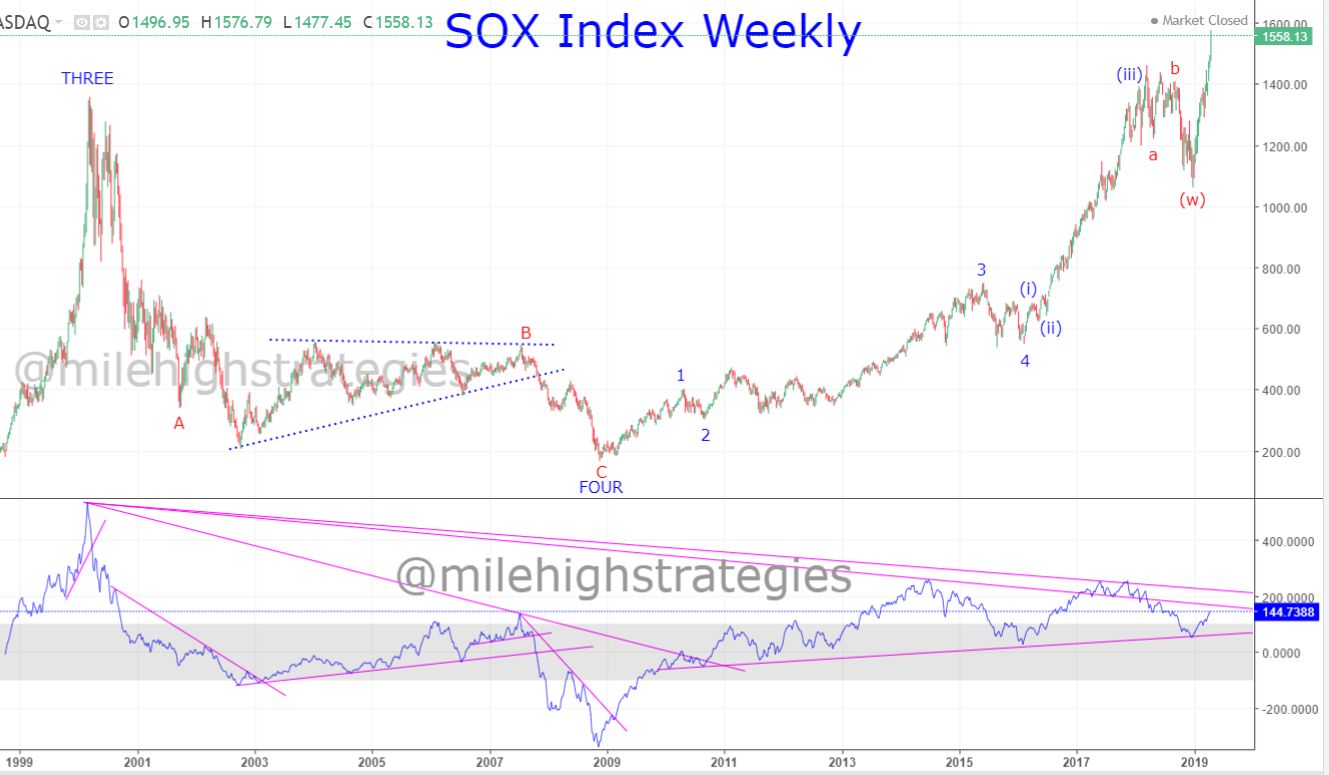
First, my forecast from 4.9.16 - the first chart is the very exact chart from nearly three years ago wherein I forecast that the SPX would move upward from the ~2000 range (2047.60) to the ~3600 range in this final installment of the US equity markets' bull market cycle...


SPX-W-EW-4-9-16-Alt.jpg


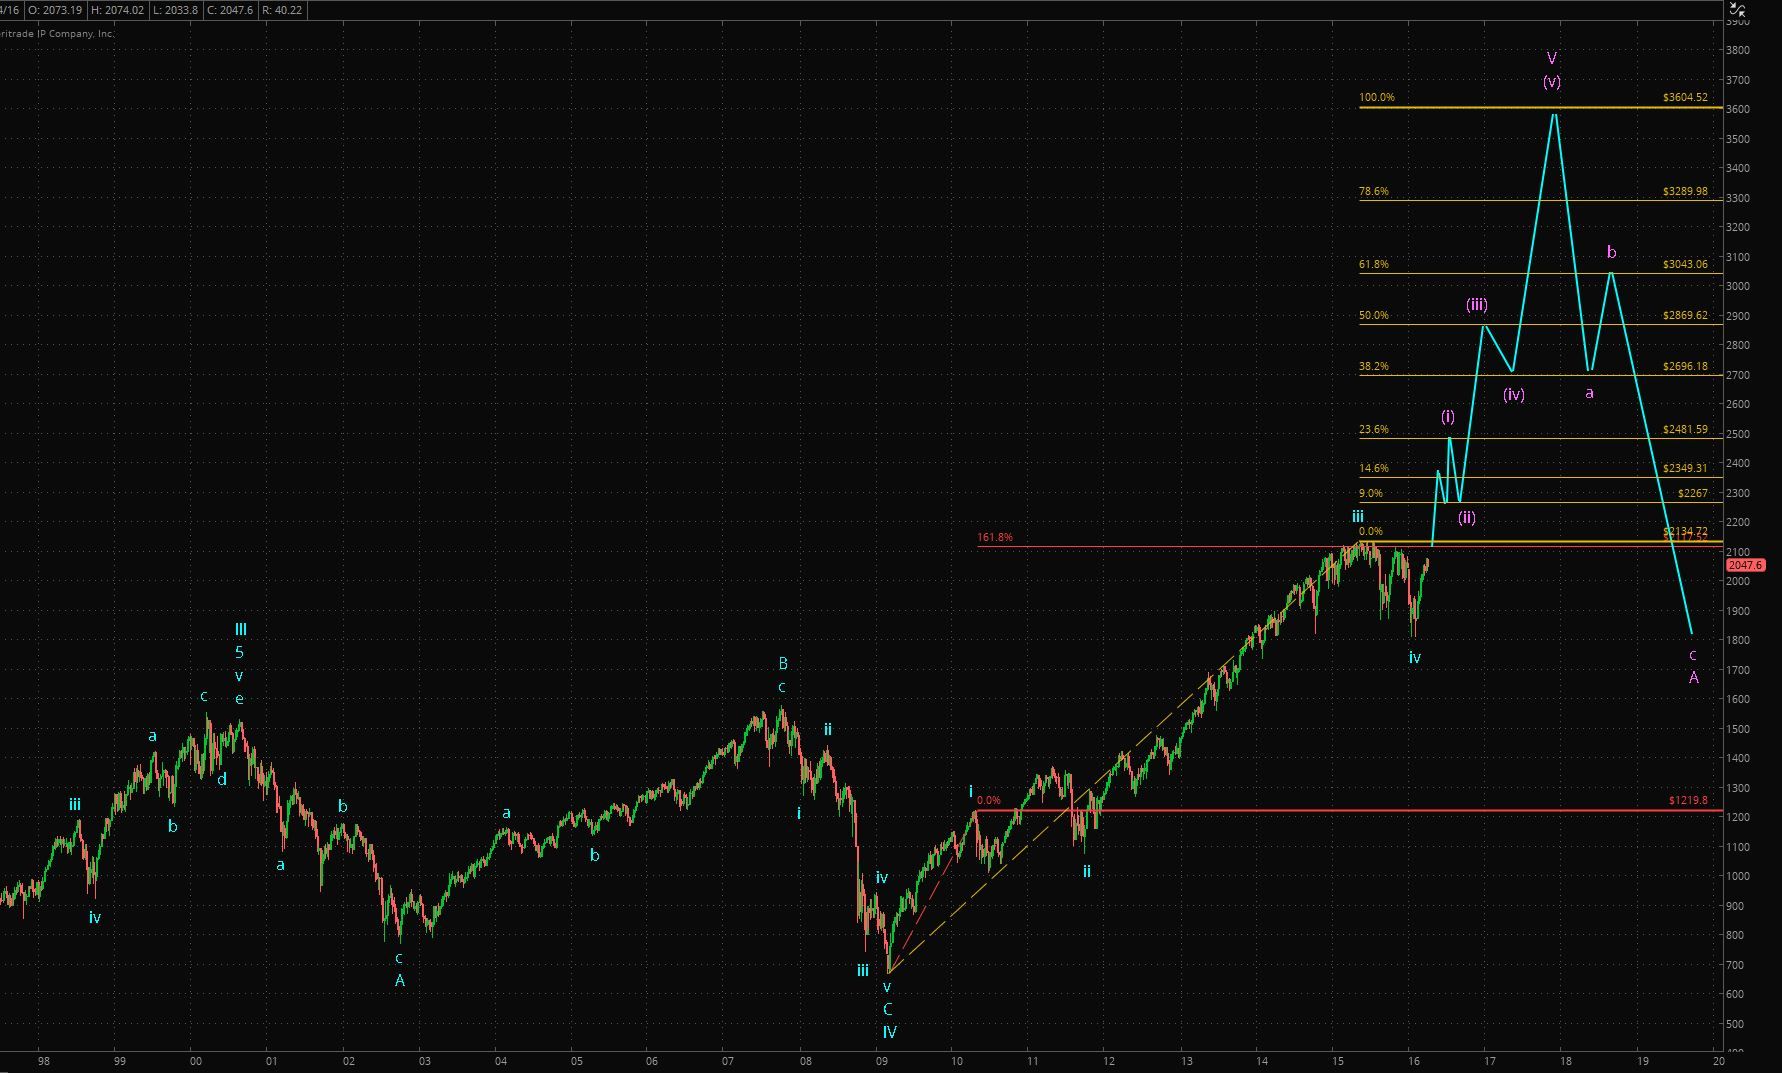
I absolutely nailed the wave-(iii) high of January 2018, to within 3.5-points of the actual high!!! I next called for a wave-(iv) completion at ~2696...


What actually happened, I covered in my earlier post (above) - rather than the SPX stopping at my target of ~2700, it proceeded down to the 14.6 Fibonacci level at the ~2350 range in Wave-(w):(iv), in what has morphed into a double zig-zag corrective fractal...


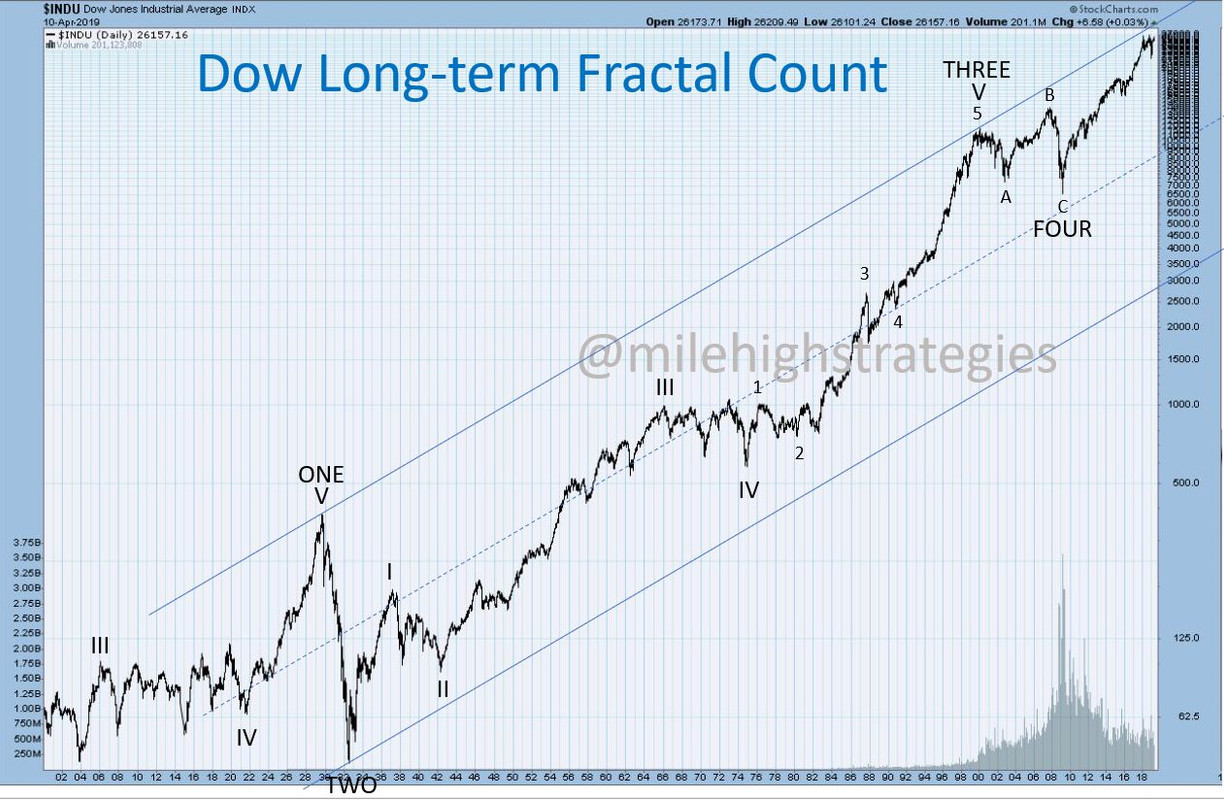
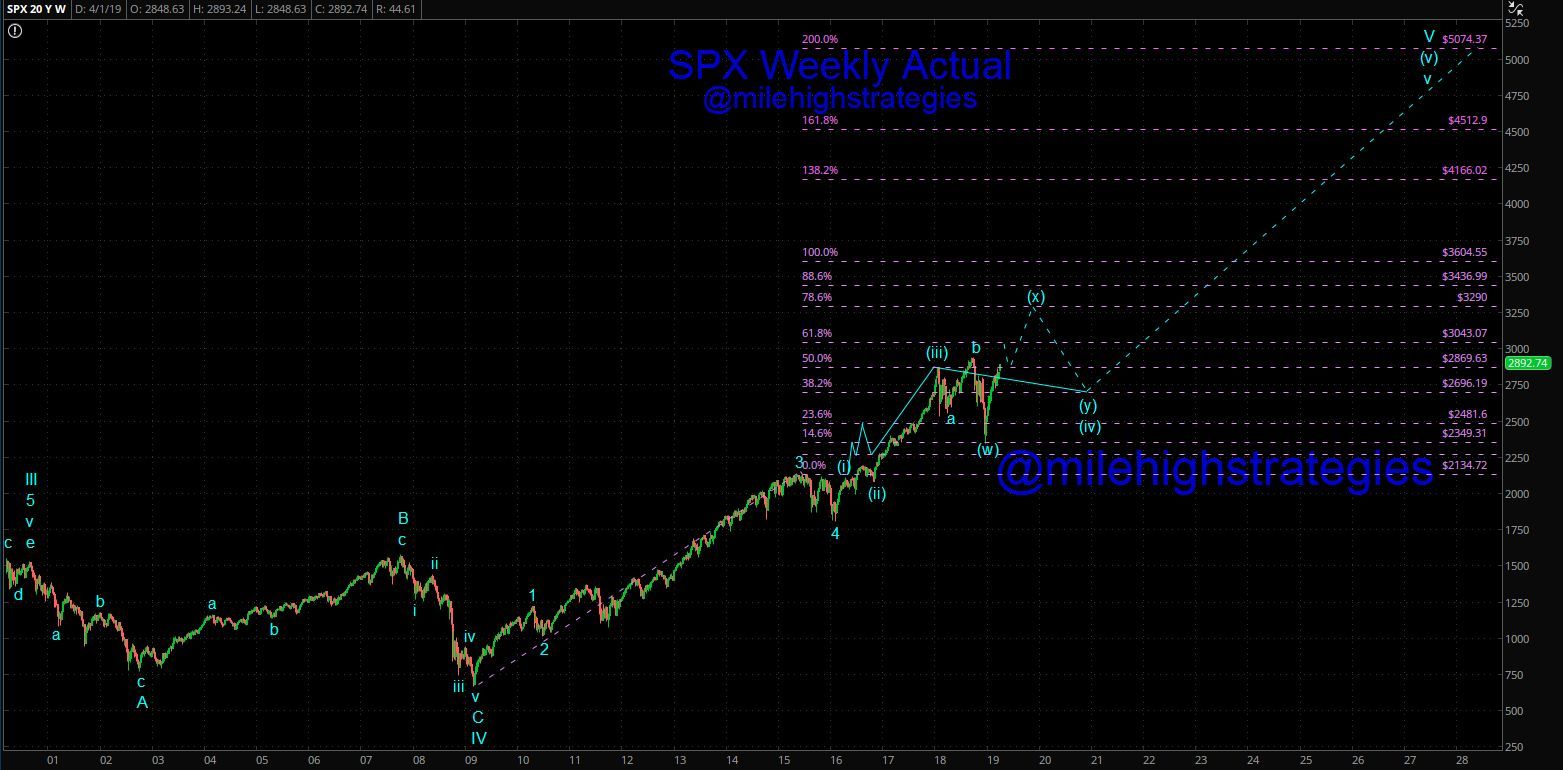
The second chart (below) provides the adjustment I've made to the forecast in light of the US equity markets electing to to extend beyond the 2021 time frame...


Despite the helluva rally we've seen in the US equity markets since the December 2018 lows, the fractal is NOT impulsive, but corrective (three wave fractals), with wave-(x):(iv) still in work, with a target up at the 78.6 Fibonacci level - ~3290 range...


Once complete, then wave-(y):(iv) will come back to my original ~2696 wave-(iv) completion target to complete a nearly 3-year larger corrective fractal structure, and then the SPX will rally upward nearly 100% into the 2028-2032 time frame to the ~5100 range...


There's a lot happening between now and then, but at least this provides some measure of context to my longer-term forecasting... watching. 


SPX-W-4-5-19-Actual-1.jpg


Edited by tsharp, 06 April 2019 - 01:45 PM.


#352 tsharp

tsharp

    Member

  • Traders-Talk User
  • 1,487 posts

Posted 21 April 2019 - 08:34 AM

GOLD - in January I said gold had reached an IT top, and since then it has dropped, making successive lower-lows...

Depending on how the last top is interpreted, there could be one more push upward, though the DTL that has marked the tops since 2016, should hold this one last time, and that would mark Wave-e:c:B:IV...


If not, then Wave-B:IV is complete with Wave-C:IV underway, which over the next several years will take the price of gold down to the ~1000 level...


I constructed an Andrews Pitchfork, with a modified Schiff setting which amazingly matches the upward channel and also suggests a low in the 950-1000 range, depending on how quickly it moves downward... watching.


XAU-USD-4-19-19.jpg


Since I made a case above for a possible last push upward to the ~1360 mark to complete wave-e:c:B:IV - depending on how the wave-c:B fractals are interpreted...


If the momentum indicator line stalls at the zero support level, with the price holding around the present range, then there's a chance one last push upwards to that price DTL is possible... watching.


GC-W-4-19-19-2.jpg


Edited by tsharp, 21 April 2019 - 08:36 AM.


#353 hhh

hhh

    Member

  • Traders-Talk User
  • 1,055 posts

Posted 21 April 2019 - 12:14 PM

What kind of an Elliott wave correction is that where the B wave (which is correcting the A wave) goes below the lowest point of A? I would've thought that would immediately rule out that it's a B and is instead ongoing A or wave C? Thanks.


#354 tsharp

tsharp

    Member

  • Traders-Talk User
  • 1,487 posts

Posted 21 April 2019 - 02:55 PM

Corrective waves can and do run... there is no such rule in fractal theory. 


A wave-ii cannot correct more than a wave-i and a wave-iii must not be the shortest impulsive wave, though expanding corrective waves are fairly common, such as the Wave-IV that took place in 1966-1974, which is only another type of corrective fractal wave.


DOW-LT-4-12-19.jpg


#355 hhh

hhh

    Member

  • Traders-Talk User
  • 1,055 posts

Posted 21 April 2019 - 08:02 PM

In the example you've shown, B doesn't go below the low of A so it actually corrected A as expected. The above is an expanded flat which is relatively common in Elliott wave.


In the previous gold chart, B doesn't correct A since it continues in the same direction as A, beyond the extent A has gone. That is why I don't recognize it as a valid Elliott wave. I would argue that once it has gone further in the direction that A went, A's termination point requirew revision, or the B wave has already changed into a C wave.


#356 tsharp

tsharp

    Member

  • Traders-Talk User
  • 1,487 posts

Posted 21 April 2019 - 10:43 PM

In the example you've shown, B doesn't go below the low of A so it actually corrected A as expected. The above is an expanded flat which is relatively common in Elliott wave.


In the previous gold chart, B doesn't correct A since it continues in the same direction as A, beyond the extent A has gone. That is why I don't recognize it as a valid Elliott wave. I would argue that once it has gone further in the direction that A went, A's termination point requirew revision, or the B wave has already changed into a C wave.


Okie dokie... you label your charts as you see fit, and I'll do the same for mine...  quite honestly, there are many methods employed by good technicians under the banner of Elliott Wave (Glen Neeley and David Bensimon come to mind).  I purposely have not used EW, with the hopes of not creating even more division among the ranks - I've called my wave work, fractal theory for years now, and the labels I've put on my chart are in accordance with correct fractal theory rules.


Here's another example of a b-wave dropping below the level of the c-wave of one order of magnitude higher, and the c-wave did not even rise to the level of the previous a-wave of the same order.  I would suggest thinking more outside the box when it comes to corrective waves, especially when they are in diagonal triangles (3-3-3-3-3-3)... they often perform like this and often also truncate in the e-wave position, though in this example the e-wave did drop just a bit lower than the previous c-wave.  


Cheers!


BTC-300-4-7-19.jpg


BTW, That bottom was called in real time on 2-9-19.


BTC-300-2-9-19.jpg


Edited by tsharp, 21 April 2019 - 10:46 PM.


#357 tsharp

tsharp

    Member

  • Traders-Talk User
  • 1,487 posts

Posted 24 April 2019 - 02:21 PM

SOX vs BITCOIN – Here’s the weekly SOX index (Philadelphia Semiconductor Index), which I haven’t featured before, but at this time I do because it’s showing precisely what I’ve been trying to warn about in the case of Bitcoin…


In 2000 we saw the DotCom mania, lead by the NASDAQ Composite Index, which did make the list of the five largest manias in western history, coming in at number five…


The SOX index didn’t even make the list, but because it’s finally recovered its mania highs, and the chart is also showing how it’s leading the broader market higher, it just makes sense to use this chart against the BTC daily chart (second chart) to illustrate how when an asset class goes parabolic in price and reaches mania-class status, the bubble ALWAYS bursts and the price remains depressed for 10-20 years…


BTC just hit the red “A” at the 2002 mark on the SOX chart… it still has all of Wave-B and Wave-C to work through before a long-term bottom is in…


Once the bottom is finally in, then the disbelief in BTC needs to slowly be replaced with belief in BTC once again… which sometimes NEVER happens – most HODLs will be long gone by this time…


The Nikkei 225 still has not recovered its 1990 highs… the Mississippi Land Deal collapsed, as did the South Sea Land deal… who’s still holding Tulip Bulbs from the 1630s?!?!


For now, BTC is in an IT uptrend… until its not… caveat emptor.


SOX-W-4-19-19.jpg?zoom=1.125&w=656&ssl=1


BTC-D-4-21-19.jpg?zoom=1.125&w=656&ssl=1


Bubbles.jpg?zoom=1.125&w=656&ssl=1


Edited by tsharp, 24 April 2019 - 02:21 PM.


#358 tsharp

tsharp

    Member

  • Traders-Talk User
  • 1,487 posts

Posted 24 April 2019 - 02:23 PM

SOX Index – Okay then, let’s look at just the SOX index and what it may imply for the global economy…


The SOX has pushed way upward to new ATHs, as I’ve been expecting the broader US equities markets to do, so it’s leading the way…


Some regard this leadership in the semiconductor industry as a leading indicator for another new business cycle in manufacturing on a global basis…


This would make lots of sense now, since it’s my theory that the deeper pullback in the US equities markets in December 2018 was a momentum reset that will allow the bull market in US equities to extend beyond the 2021 time frame I was originally looking for…


The SOX weekly chart can be interpreted several ways from a fractal perspective, though it seems to make the most sense to look at it in the same way as the SPX, Dow and NDX, as a double zig-zag corrective fractal structure, with wave-(x):(iv) in work now… watching.


SOX-W-4-19-19-1.jpg


Semiconductors-point-to-manf-growth-2.jp


Semiconductors-point-to-manf-growth.jpg?


Edited by tsharp, 24 April 2019 - 02:24 PM.


#359 dowdeva

dowdeva

    Member

  • Traders-Talk User
  • 525 posts

Posted 23 May 2019 - 07:28 PM

Tsharp,


Can you give one of your excellent market analysis here?


How's that huge brood of yours? Start your own city yet?


Best regards,


~D


#360 tsharp

tsharp

    Member

  • Traders-Talk User
  • 1,487 posts

Posted 24 May 2019 - 06:38 PM

D,


One of my sons graduated high school last night, and carried a 4.0 GPA; I'm very proud of him... thank you for asking!


The LT and IT trends are up, and I'm just waiting for the ST to rejoin them, which could be as soon as the globex session on Sunday. 


The first chart is today's 240-min SP00s with my momentum set-up... very near a CIT, though is still short from 2855.


SP00-240-5-24-19-1.jpg


15-min SP00s:


SP00-15-5-24-19-1.jpg


This chart is my fractal interpretation of the 300-min SP00s, showing either wave-b (orange) complete or the last low may also be the green wave-b... either way, the path is upward either immediately to the ~3040 range in black wave-b or black wave-b is already complete and wave-c:(x) is starting upward after a bit more back-and-fill. then when the breakout of the orange zone takes place, the price target would be ~3290 into year's end... twt.


SP00-300-5-24-19.jpg


Edited by tsharp, 24 May 2019 - 06:43 PM.