Was that 5 of 1 of 3 on SPX , 5 of 3 ? Looks topped out, wave 2 or 4 next.

SPX thoughts
Started by
tsharp
, Feb 28 2016 01:13 AM
363 replies to this topic
#342

tsharp
-
- Traders-Talk User
- 1,487 posts
Member
Posted 12 June 2018 - 11:08 AM
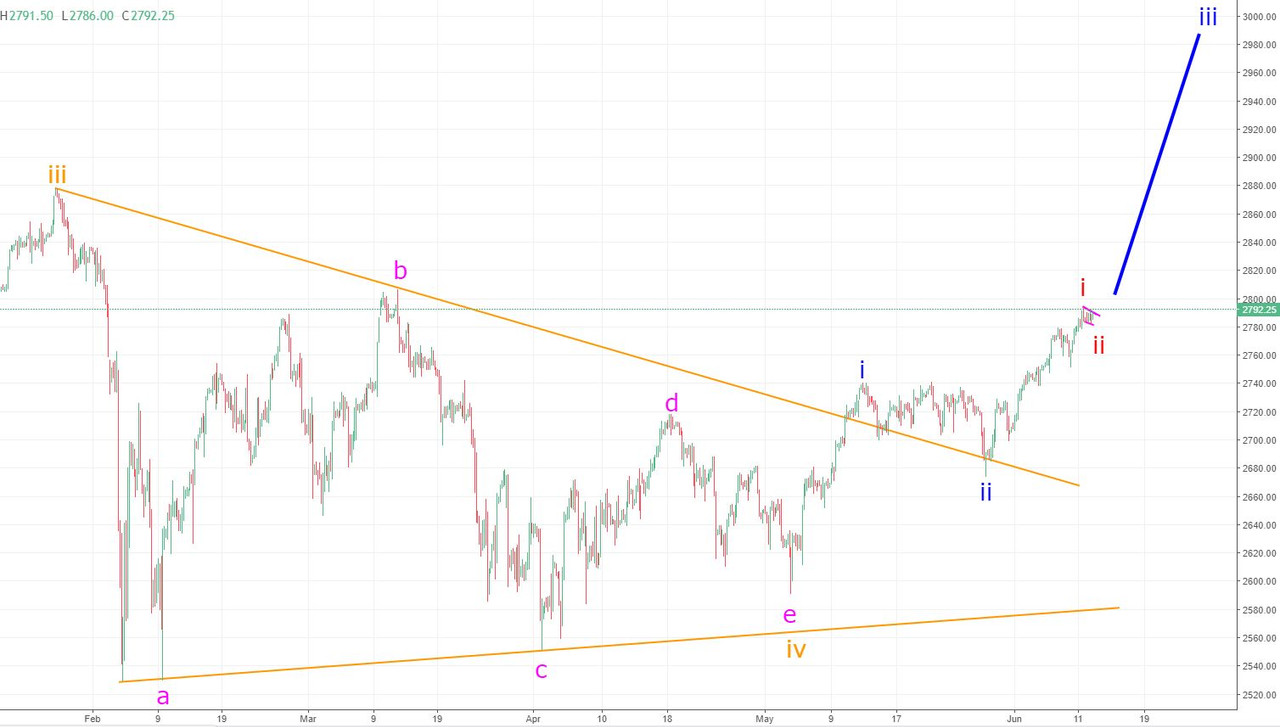
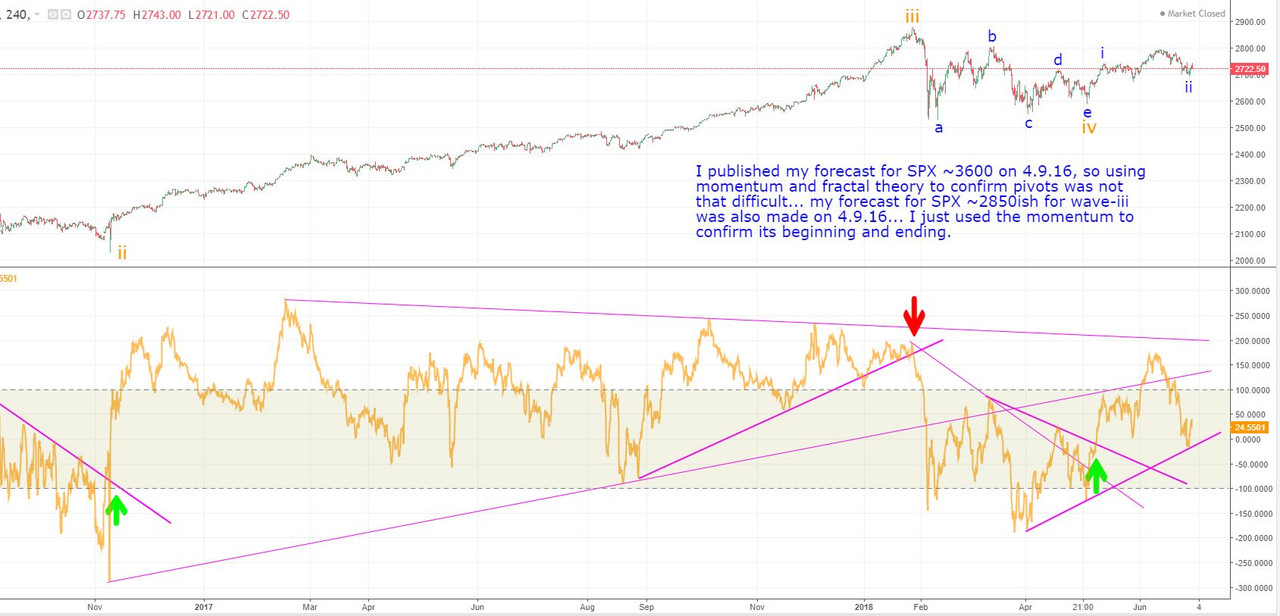
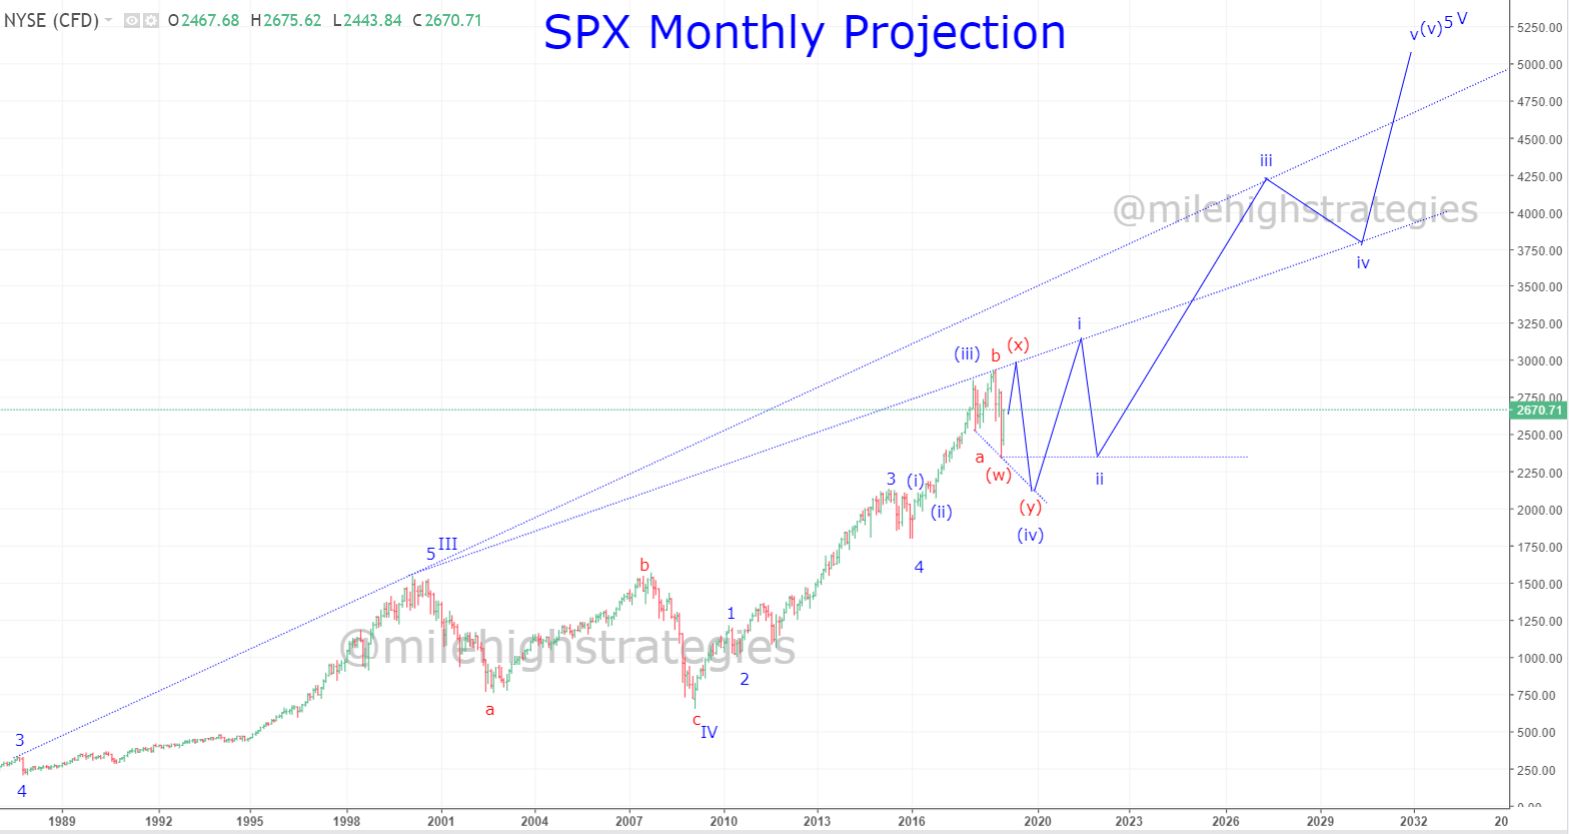
The SPX is in wave-iii:v... I see wave-iii terminating at the ~3000 level, then a wave-iv, then wave-v to take it to the ~3600 level.
I pointed out the bullish flag last evening that should lead up to the 2825 level... I'm not sure wave-ii is complete yet and may be a running wave-ii, which will push the red ii upwards... time will tell.
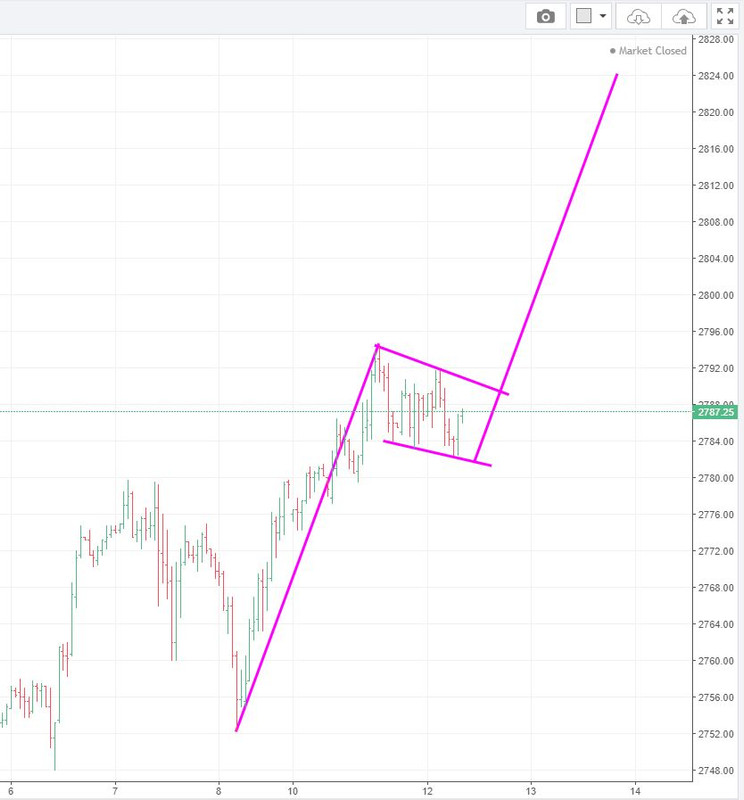
Link to chart: https://postimg.cc/image/ec0fx3cvb/
Link to chart: https://postimg.cc/image/5487ga37b/
#343
CLK
-

- Traders-Talk User
- 10,787 posts
Member
Posted 12 June 2018 - 04:27 PM
Yes, I was talking about the red 1 wave, I saw the 5 of 1 wave with divergence, I thought 2 would have given more back. Probably is a running correction. I thought about shorting the open but the internals opened ok.
#344
tsharp
-
- Traders-Talk User
- 1,487 posts
Member
Posted 13 June 2018 - 06:19 AM
Here's an alternate count I'm watching...
FOMC could trigger another thrust upward.. twt.
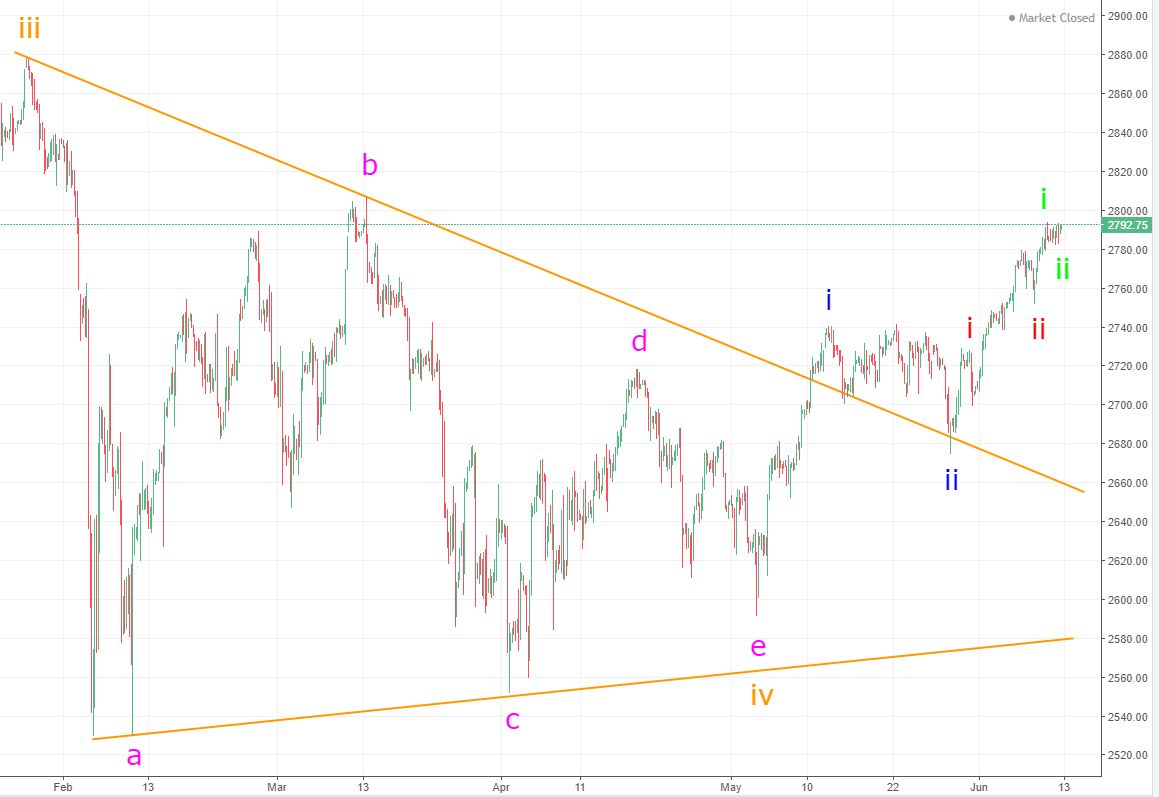
Edited by tsharp, 13 June 2018 - 06:20 AM.
#345
tsharp
-
- Traders-Talk User
- 1,487 posts
Member
Posted 30 June 2018 - 09:00 PM
Hey gang,
It's been a while... I'm extremely busy with work, kiddos out for the summer, school and such, so don't get by here as often as I would like. If my work piques your interest, you can follow it more regularly on my Instagram feed: @milehighstrategies
Three charts today... first the 240-min SP00s from Nov 2016 with my momentum indicator set-up that nicely catches the major pivots:
Link to chart: https://postimg.cc/image/q149lr4dl/
Next, the Monthly SPX from the late 70s that shows the present bull market is still in tact and not yet entered into the negative divergence phase, as it did in the late 90s... the bull market's days are numbered, but the highs still seem to be a couple years out... time will tell.
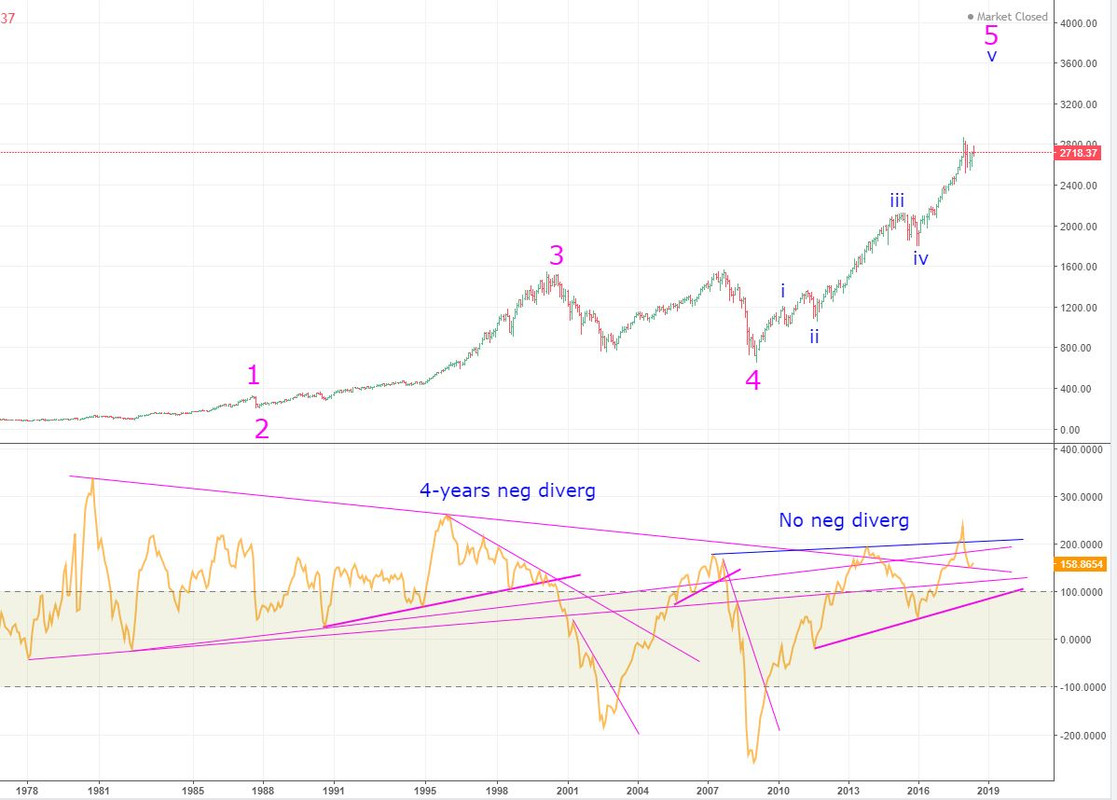
LInk to chart: https://postimg.cc/image/un0du5fmx/
Finally, the weekly SPX from the beginning of the current bull market (1982) that confirms the same as the monthly SPX:
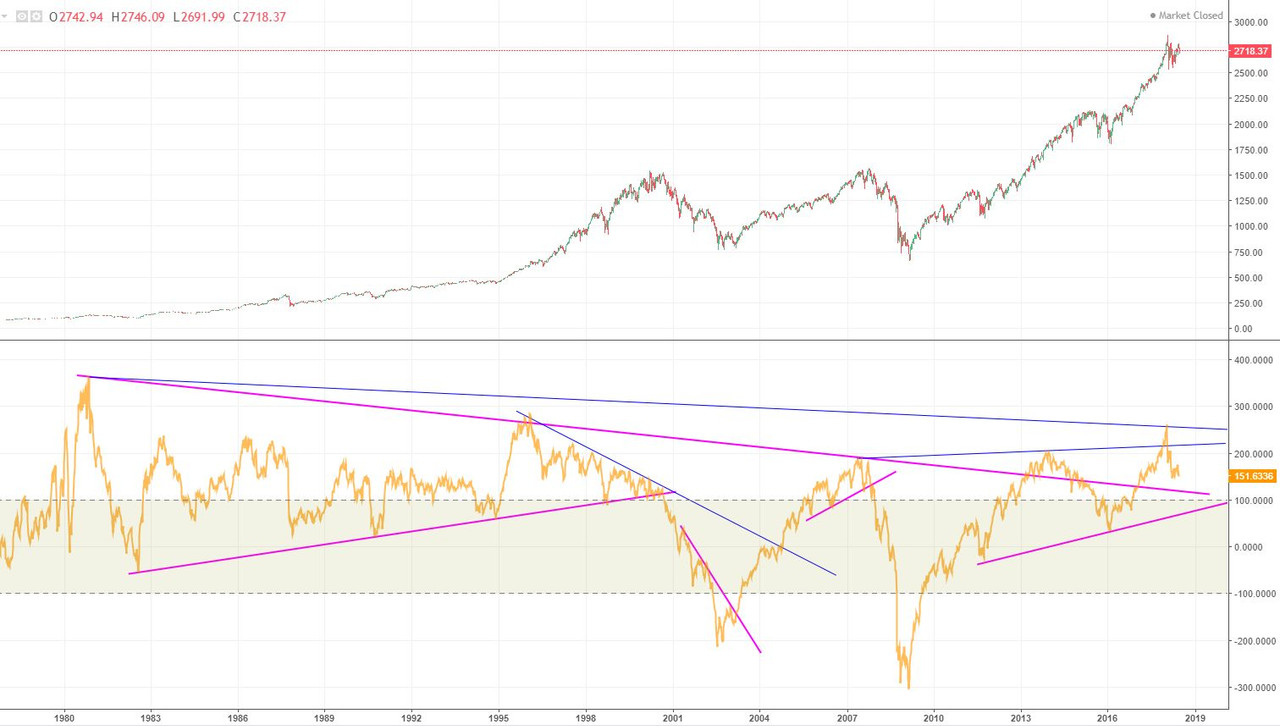
Link to chart: https://postimg.cc/image/gtc152zw9/
#346
tsharp
-
- Traders-Talk User
- 1,487 posts
Member
Posted 25 January 2019 - 10:09 AM
US Bull Market Extended into 2032
This article is from several posts I’ve made over the past weekend regarding a change I’m tentatively making in my long-term fractal count on the SPX specifically and in the US equities markets in general.
Due to last year’s Dow closing below the previous year’s level, Martin Armstrong’s @armstrongeconomics computer is now no longer looking for the US equities bull market top in the ~2021 time frame, but rather to extend out to the ~2032 time frame. I totally respect the Pi time series work Martin has pioneered and I have not ever known his computer to be wrong about anything markets related, so I am willing to give it the benefit of the doubt, until or unless events cause it to change its forecast.
If interested, you can read the rest of the article here: http://milehighguyll...rket-into-2032/
Edited by tsharp, 25 January 2019 - 10:11 AM.
#347
tsharp
-
- Traders-Talk User
- 1,487 posts
Member
Posted 26 January 2019 - 01:01 PM
The Banking Sector
The BKX is the US banking index, and in light of some of the key members, such as BAC and C, being in bear markets since 2007, I thought the BKX had peaked and rolled over also…
However, in light of the possibility that the US equity markets continue their long-term bull market trend out until ~2032, here’s a look at the BKX (and the six largest US banks) with an alternate fractal count that extends the bull market in the banking sector…
If this fractal interpretation is correct, then the BKX is in a wave-d:V, with one more leg down possible, but not necessary… watching…
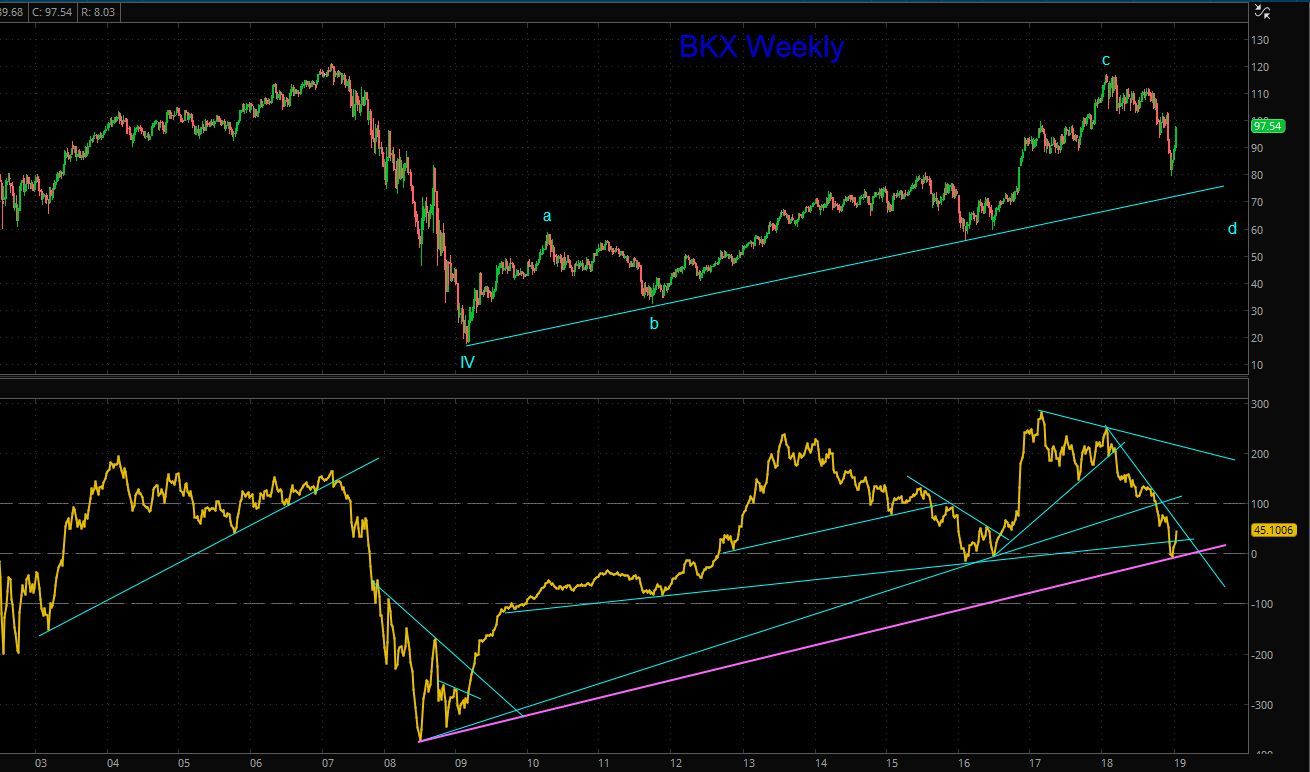
If interested, you can read the rest of the article (with charts and commentary on the six largest US banks) here: http://milehighguyll...banking-sector/
Edited by tsharp, 26 January 2019 - 01:02 PM.
#348
tsharp
-
- Traders-Talk User
- 1,487 posts
Member
Posted 01 February 2019 - 09:56 AM
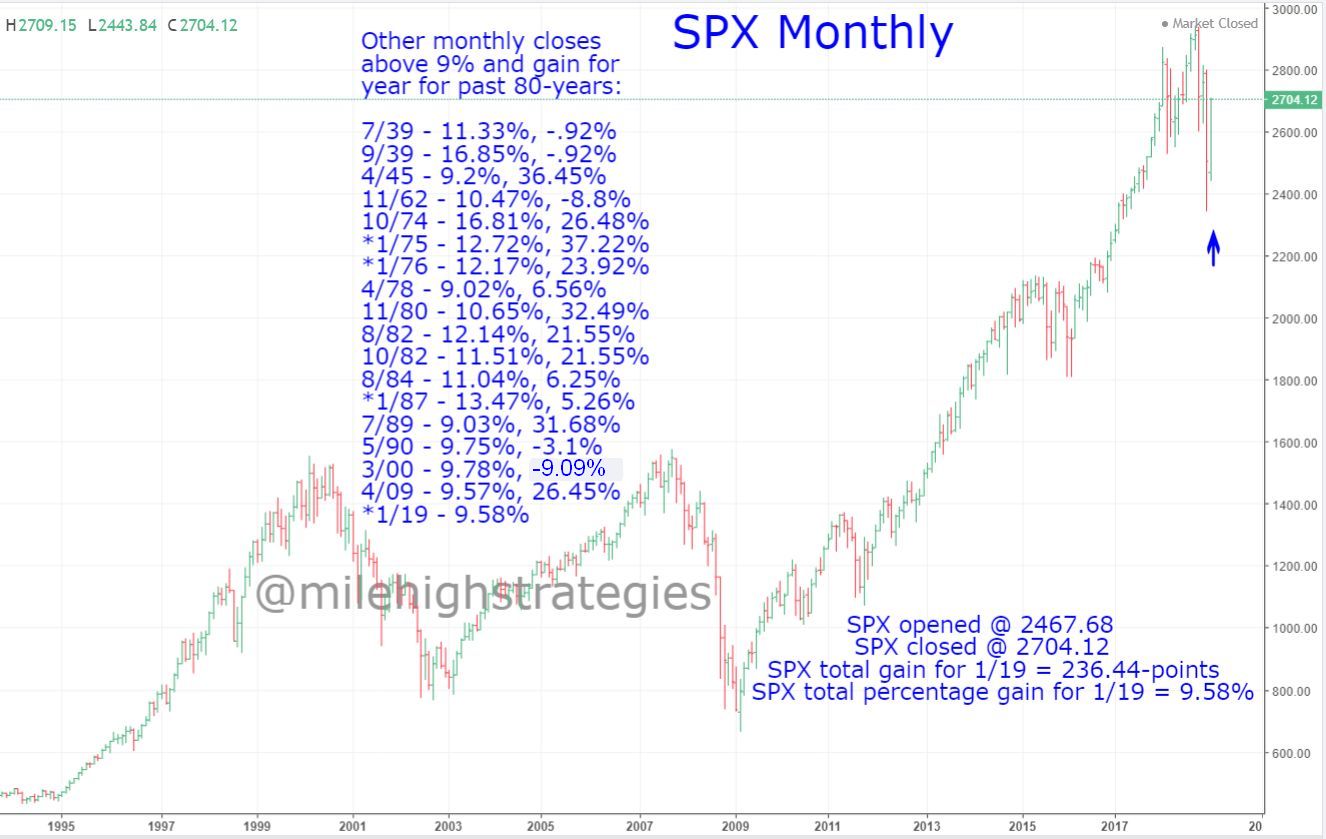
January 2019 SPX – One of the Best EVER
S&P 500 Index – did you realize that January 2019 was one of the best gaining months ever for the SPX, and only one of eighteen times since 1939 that the SPX closed more than 9% higher for the month?
And from a point-perspective, the SPX has never seen a ~236 point gain in a single month…
Of the 17 previous times there has been a gain of over 9% in a single month for the SPX, only five times did it end the year negative, and one of those times, 1939, it happened twice in that year (-.92% for the year)… the worst instance was in 2000 where the SPX ended -9.09% for the year…
If interested you can read the rest of the article here: Link
#349
tsharp
-
- Traders-Talk User
- 1,487 posts
Member
Posted 18 February 2019 - 03:39 PM
Let’s suppose the RH&S plays out (below), that’s actually a measured move up to another of my 4.9.16 projections, at ~3290 (a budget deal and a trade deal could do push this upward)…
Then let’s say we end the year at new ATHs, but then consternation over the 2020 election cycle pushes us into a corrective limbo and mini-recession…
Then the elections pass, the world doesn’t end, and the great bull market resumes…
The ~2696 range is the level on my 4.9.16 forecast for the completion point of wave-(iv), so that would be all kinds of ironic… and of course I’m just speculating here – that’s what forecasters do – we try to think outside the box, yet still in the realm of possibility… watching.
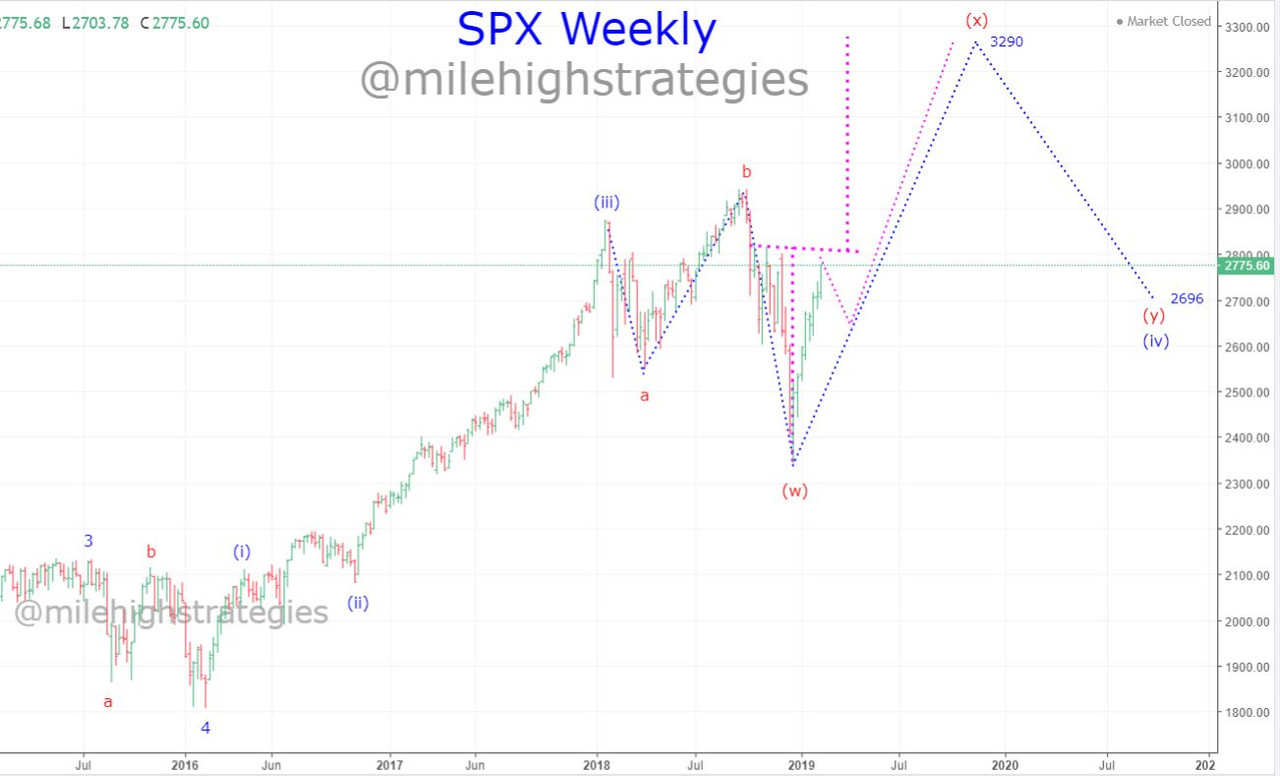
That said, here’s a remake of the SPX monthly projection chart I recently publish, but without the severe drop in the wave-(y):(iv) leg down…
If this fractal interpretation plays out, 2019 will be a helluva year, but 2020 will feel like a new bear market…
Could a Trump victory in 2020 be the catalyst that turns the US equity markets back upward? I dunno… watching.

Edited by tsharp, 18 February 2019 - 03:39 PM.
#350
tsharp
-
- Traders-Talk User
- 1,487 posts
Member
Posted 04 March 2019 - 09:12 AM
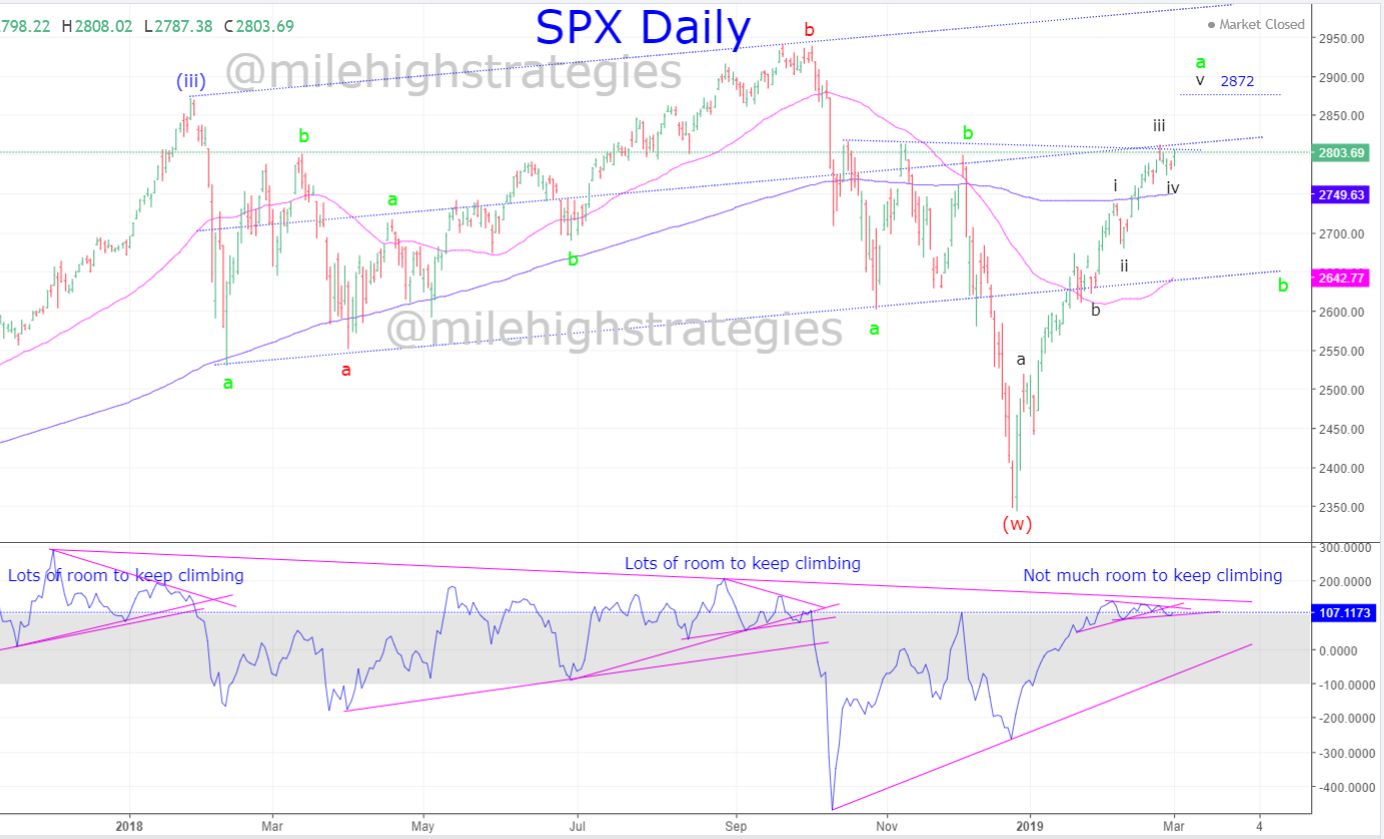
SPX may extend to the next fib level... observations from Saturday blog: http://milehighguyllc.com/blog/
My forecast from 1.25.19:
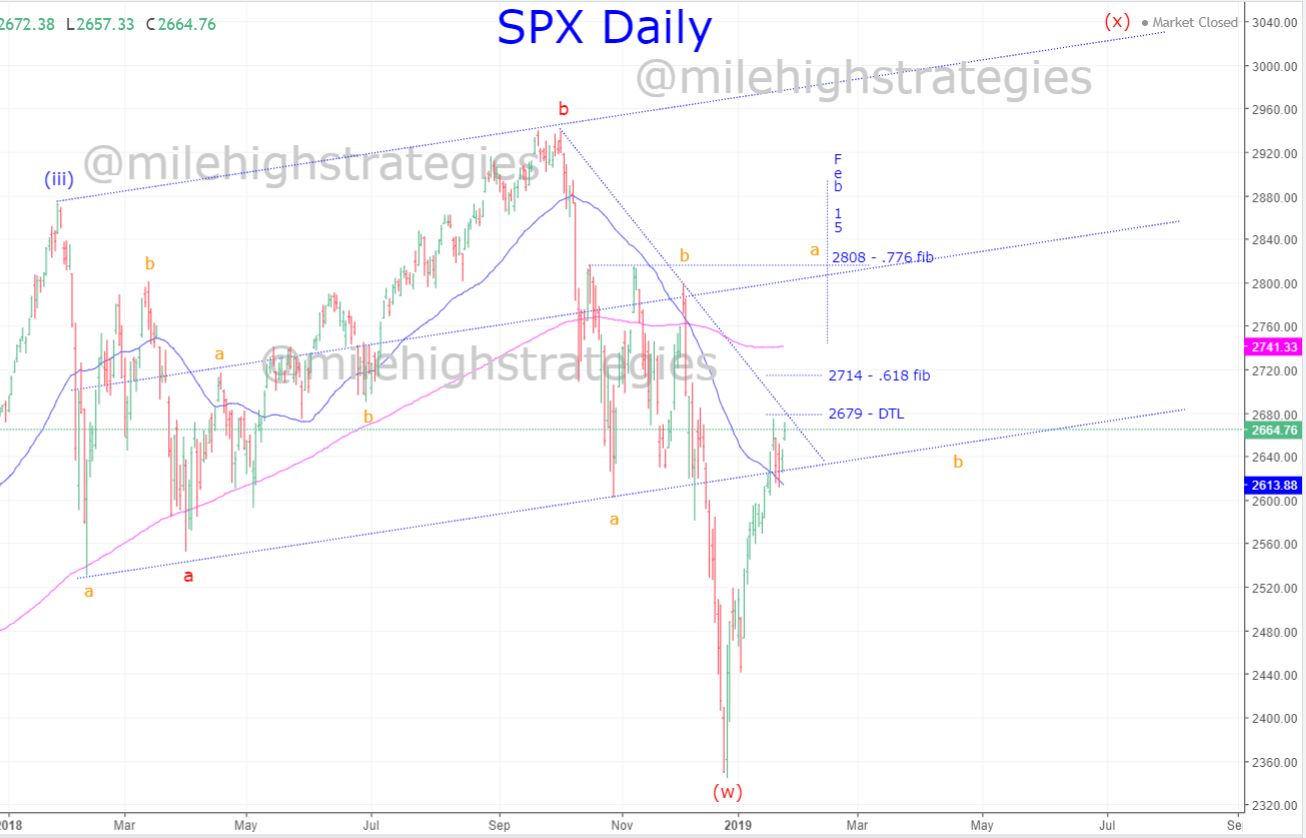
Friday's close:
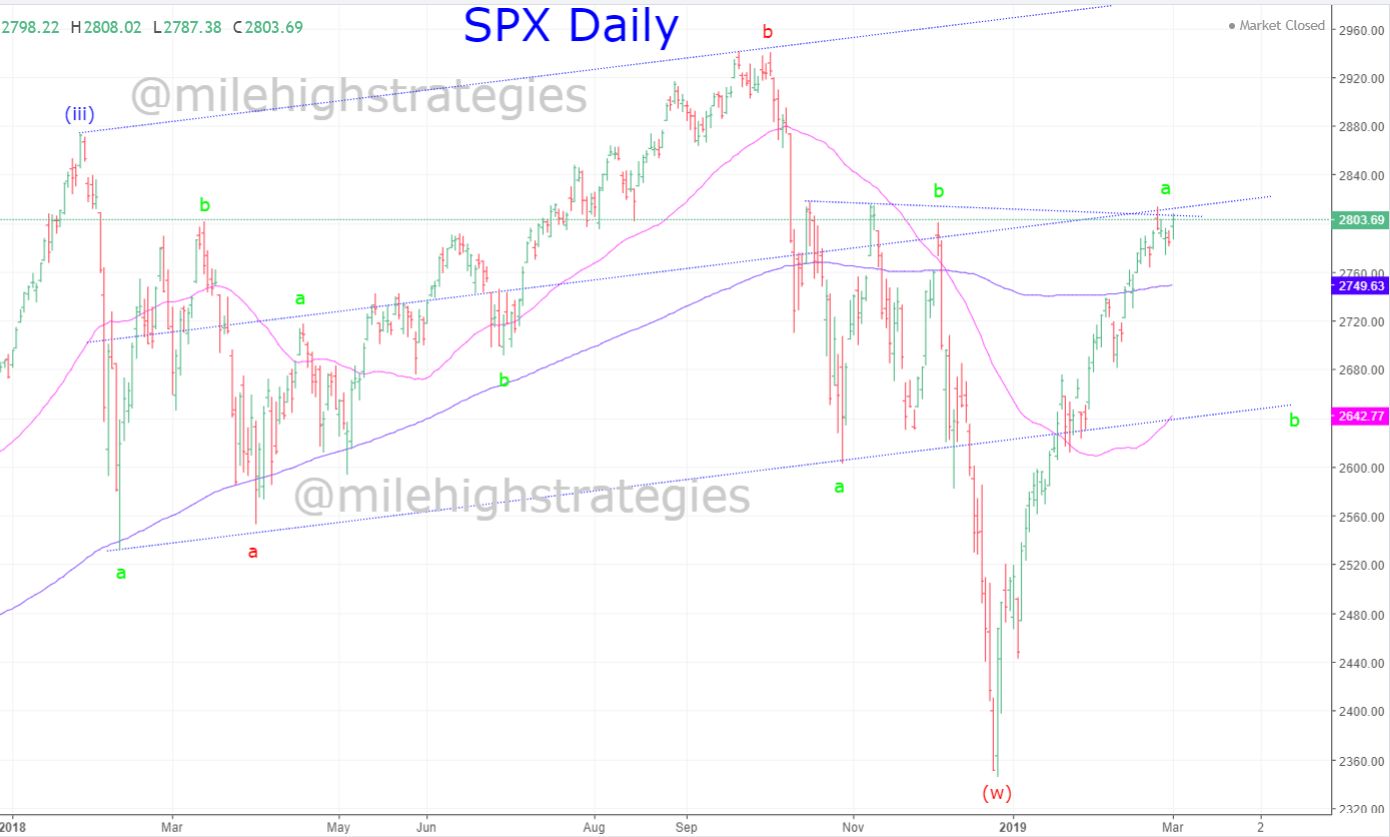
Alt higher target: