
Copper is interesting to be sure

what now?
Started by
dharma
, Jul 10 2017 10:28 AM
475 replies to this topic
#102

Russ
-

- Traders-Talk User
- 7,199 posts
Member
Posted 25 July 2017 - 11:46 PM
Copper is interesting to be sure
copper looks like it is headed for a major high in summer 2018., perhaps around 6 dollars.
"Nulla tenaci invia est via" - Latin for "For the tenacious, no road is impossible".
"In order to master the markets, you must first master yourself" ... JP Morgan
"Most people lose money because they cannot admit they are wrong"... Martin Armstrong
http://marketvisions.blogspot.com/
"In order to master the markets, you must first master yourself" ... JP Morgan
"Most people lose money because they cannot admit they are wrong"... Martin Armstrong
http://marketvisions.blogspot.com/
#103
dharma
-
- Traders-Talk User
- 9,621 posts
Member
Posted 26 July 2017 - 09:50 AM
Wcopper having a good move yesterday fcx was up 15%. since 1996 the gold miners have been in a downtrend vs gold. when gold breaks out of this tr i expect the laggard mining sector to have spectacular gains. they will just be catching up to a more normal relationship vs gold. this move is coming soon. if this rally is a Cor a 3 it will be soon. as is always the case, until we are in the parabolic, the mo in this sector is to buy weakness.
my view here is we had a 5 wave advance that we are now correcting. the correction should end very soon. 1245 is support and 1229 is the start of this price cycle. we have not given much ground since the highs. today is expiration on the comex. expect the usual wash, rinse , and repeat cycle . those who looked at this sector as a get rich quick scheme, met their waterloo in 13-15 the tide is slowly turning the infrastructure has been put in place. over the next couple of years. the center of the gold universe will be migrating . east comex and lbma , both a den of vipers, will be relegated to a 2ndary role
patience. 18 will be the year when the shift takes place.
dharma

#105
jabat
-

- Traders-Talk User
- 606 posts
Member
Posted 26 July 2017 - 10:23 AM
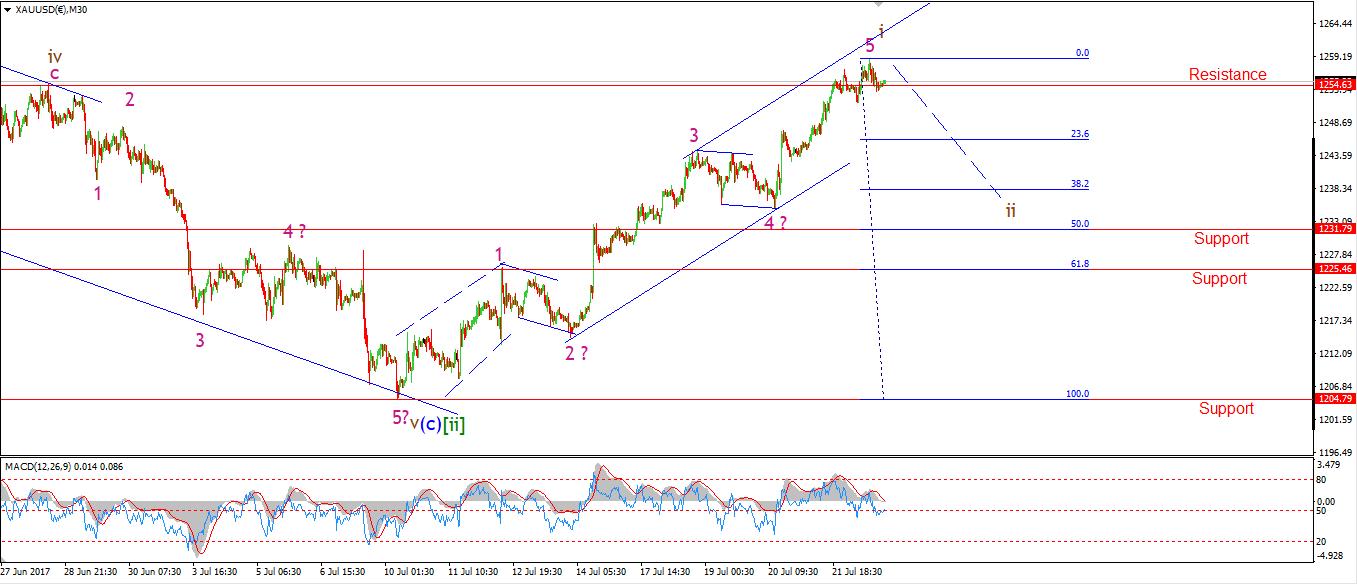
This from the work of Enda Glynn
#106
Russ
-
- Traders-Talk User
- 7,199 posts
Member
Posted 26 July 2017 - 01:29 PM
XAU has broken above it's down trend line from last august, yesterday's drop is looking like it was just a test of support on that line, so Hadik appears to be wrong and much higher prices are coming as it breaks out of it's big wedge.
"Nulla tenaci invia est via" - Latin for "For the tenacious, no road is impossible".
"In order to master the markets, you must first master yourself" ... JP Morgan
"Most people lose money because they cannot admit they are wrong"... Martin Armstrong
http://marketvisions.blogspot.com/
"In order to master the markets, you must first master yourself" ... JP Morgan
"Most people lose money because they cannot admit they are wrong"... Martin Armstrong
http://marketvisions.blogspot.com/
#107
gannman
-

- Traders-Talk User
- 6,948 posts
Member
Posted 26 July 2017 - 01:38 PM
big important day here for the sector if it maintains and doesnt fade bodes very well for everything in the sector
after long agony rapture and bliss right.
feeling mellow with the yellow metal
#108
goldfungus
-

- Traders-Talk User
- 538 posts
Member
Posted 26 July 2017 - 01:54 PM
big important day here for the sector if it maintains and doesnt fade bodes very well for everything in the sector
after long agony rapture and bliss right.
Still in my foxhole but the sky looks blue from my POV. LOL
#109
tradesurfer
-

- Traders-Talk User
- 2,944 posts
Member
Posted 26 July 2017 - 02:14 PM
I wrote down 1260.85 as the NUMBER to break north from in JULY on the monthly. looks like we are above it. This is the number that is a BREAKOUT from the long term 2011 down trend.
XAU has broken above it's down trend line from last august, yesterday's drop is looking like it was just a test of support on that line, so Hadik appears to be wrong and much higher prices are coming as it breaks out of it's big wedge.
#110
Russ
-
- Traders-Talk User
- 7,199 posts
Member
Posted 26 July 2017 - 02:27 PM
I wrote down 1260.85 as the NUMBER to break north from in JULY on the monthly. looks like we are above it. This is the number that is a BREAKOUT from the long term 2011 down trend.
XAU has broken above it's down trend line from last august, yesterday's drop is looking like it was just a test of support on that line, so Hadik appears to be wrong and much higher prices are coming as it breaks out of it's big wedge.
You can see more clearly what is going on on that gold chart on the weekly, it poked it's head above that line in april and may and retreated, this time it is likely going to stay above water.
"Nulla tenaci invia est via" - Latin for "For the tenacious, no road is impossible".
"In order to master the markets, you must first master yourself" ... JP Morgan
"Most people lose money because they cannot admit they are wrong"... Martin Armstrong
http://marketvisions.blogspot.com/
"In order to master the markets, you must first master yourself" ... JP Morgan
"Most people lose money because they cannot admit they are wrong"... Martin Armstrong
http://marketvisions.blogspot.com/


