Jump to content


Photo

bottoming process continues


  • Please log in to reply
911 replies to this topic

#341 EHW

EHW

    Member

  • Traders-Talk User
  • 53 posts

Posted 28 January 2019 - 09:19 AM

Do you mean 1285-1295? 1185-1195? Thats a big pullback. Thanks.


So far this morning spot gold holding above $1300.  However, i think gold will be pulling back shortly to about the 1195 to 1185 area.  Could be a good area to add to longs or, if you are not in gold or gold stocks as yet, could also be a good time to start and pick up some at a very reasonable prices.


Edited by EHW, 28 January 2019 - 09:20 AM.


#342 jabat

jabat

    Member

  • Traders-Talk User
  • 606 posts

Posted 28 January 2019 - 09:55 AM

gold-historical-kiss-taking-place-jan-28


#343 johngeorge

johngeorge

    Member

  • TT Member+
  • 4,616 posts

Posted 28 January 2019 - 10:04 AM

Do you mean 1285-1295? 1185-1195? Thats a big pullback. Thanks.


So far this morning spot gold holding above $1300.  However, i think gold will be pulling back shortly to about the 1195 to 1185 area.  Could be a good area to add to longs or, if you are not in gold or gold stocks as yet, could also be a good time to start and pick up some at a very reasonable prices.

EHW  Yes, I meant 1185-1195.  Sorry my bad.  I was half asleep when I posted.  Thanks for pointing it out to me.


Peace
johngeorge

#344 dharma

dharma

    Member

  • Traders-Talk User
  • 9,625 posts

Posted 28 January 2019 - 12:03 PM

fed this week, wednesday announcement. folks will be hanging on every word powell utters

indian budget on the 1st , modi running for re election never mind he did a terrible job

then there is the chinese new years coming up soon. 

gold is looking for a catalyst.  

i read that in 72 countries gold made a new high

dharma


#345 Russ

Russ

    Member

  • Traders-Talk User
  • 7,203 posts

Posted 28 January 2019 - 05:28 PM


gold-historical-kiss-taking-place-jan-28


It depends on whether you think drawing the trend line off the very tops of each bar or drawing it off the closes is the most valid trendline, drawing the line off the tops shows that gold already broke above the down trend from 2011. 


"Nulla tenaci invia est via" - Latin for "For the tenacious, no road is impossible".
"In order to master the markets, you must first master yourself" ... JP Morgan
"Most people lose money because they cannot admit they are wrong"... Martin Armstrong


http://marketvisions.blogspot.com/

#346 Russ

Russ

    Member

  • Traders-Talk User
  • 7,203 posts

Posted 28 January 2019 - 07:13 PM

FYI.... 

How to draw and use trendlines 101

"Generally speaking, it is advisable to wait for three confirmed points of contacts before you start putting further attention to a trendline. Most traders make the mistake and connect the first two highs or lows and then get overly excited once price gets there again. However, a trendline is only confirmed if you can get three points of contacts. Whereas connecting two random points is possible at any time at any chart, three points of contacts are no coincidence anymore.

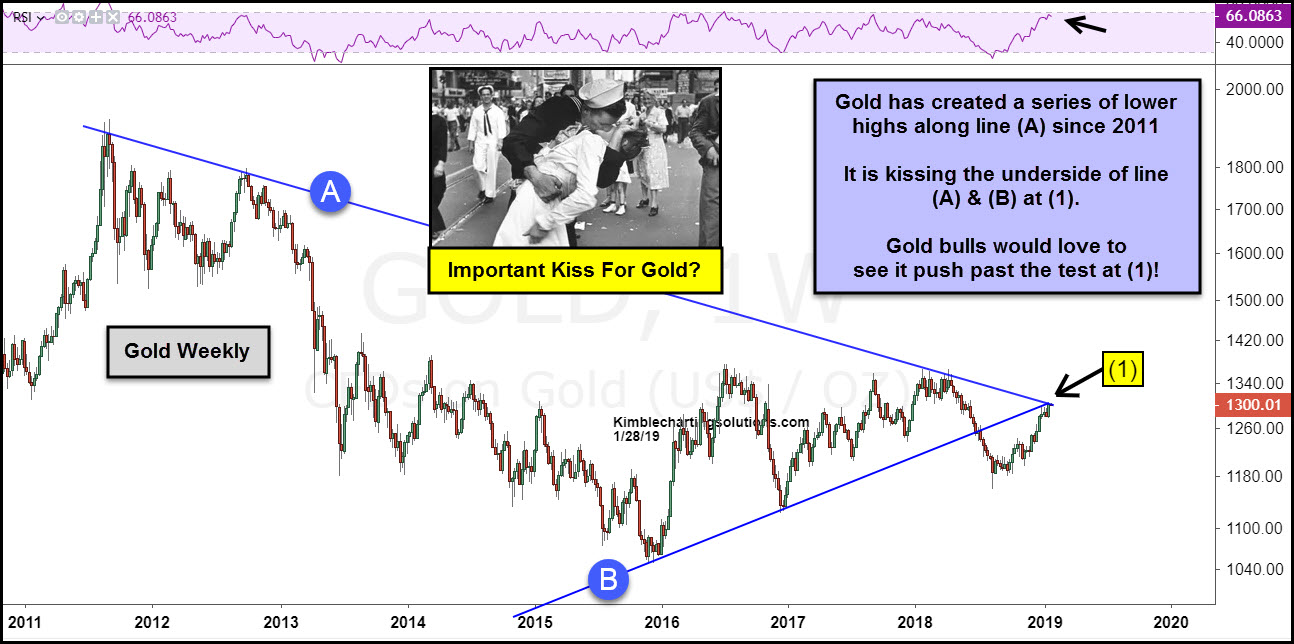
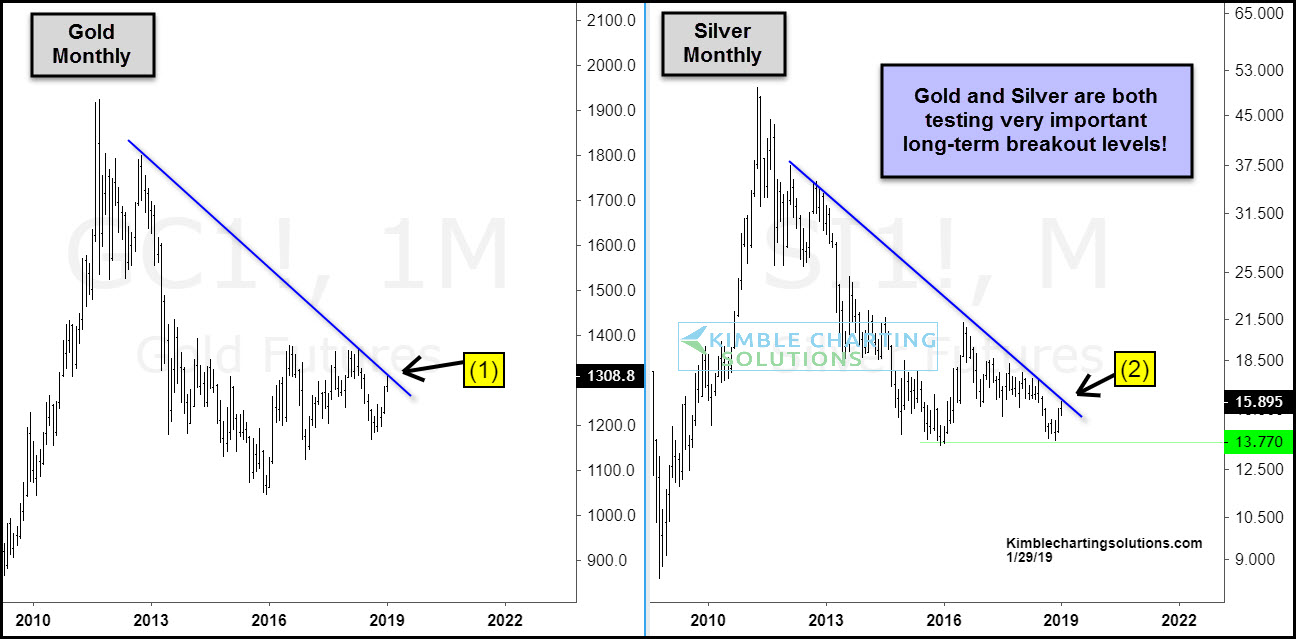
The next question that always comes up is whether you should use the candle-wicks or the candle-bodies to draw the trendlines!? The answer is: confluence”. Whenever you get the best and the most contact points and confluence around your trendline, that’s how you draw it. There are no fixed rules about whether wicks or bodies are better. Just look for a trendline that gives you the most confirmation without beeing violated too much. Having said that, I don’t mind violations of just candle wicks as much as of candle bodies."  https://www.tradeciety.com/how-to-use-trendlines/    .... Based on the above there is more 'confludence' or contact points on my chart than Kimble's chart (the white one) since the bottom support line from 2001 is showing massive support on multiple points, which means that my chart of more valid and Gold has already broken above it's down trend line from 2011, my trend line is drawn exactly off of the fixed point (magnet mode) on tradingview, so there is no room for approximation on the placement of the line, the line is drawn in the only place it can be. Russ


Edited by Russ, 28 January 2019 - 07:16 PM.

"Nulla tenaci invia est via" - Latin for "For the tenacious, no road is impossible".
"In order to master the markets, you must first master yourself" ... JP Morgan
"Most people lose money because they cannot admit they are wrong"... Martin Armstrong


http://marketvisions.blogspot.com/

#347 Smithy

Smithy

    Member

  • Traders-Talk User
  • 2,298 posts

Posted 28 January 2019 - 10:57 PM

Well,  Senor, for example I like 1181 on 9/27  as a starting point, and count  4 waves  1 = 1243 on 10/26, 2 = 1196 on 11/13, 3 = 1298 on  1/3 and 4 ended 1/21 at 1277...... what would be the best method to estimate the peak for 5 for this count.


#348 Smithy

Smithy

    Member

  • Traders-Talk User
  • 2,298 posts

Posted 28 January 2019 - 11:06 PM

I did some digging around on Sibanye Gold  (SBGL). It turns out Gold Fields lumped its South African gold operations into one entity and hived it off. SBGL is one of the top ten world gold producers and the third largest producer of palladium and platinum. The price has risen 8% in the last 2 days. DYODD etc.


#349 dougie

dougie

    Member

  • Traders-Talk User
  • 9,071 posts

Posted 29 January 2019 - 01:11 AM

So far this morning spot gold holding above $1300.  However, i think gold will be pulling back shortly to about the 1195 to 1185 area.  Could be a good area to add to longs or, if you are not in gold or gold stocks as yet, could also be a good time to start and pick up some at a very reasonable prices.

Why JG?


#350 jabat

jabat

    Member

  • Traders-Talk User
  • 606 posts

Posted 29 January 2019 - 09:06 AM

gold-silver-facing-long-term-breakout-le