How are you managing your long positions if not?
Wide stops, puts, small long positions up here and mostly cash, not concerned and won't sell
if we get below September lows?

Member
Posted 16 October 2020 - 08:15 PM
How are you managing your long positions if not?
Wide stops, puts, small long positions up here and mostly cash, not concerned and won't sell
if we get below September lows?
Member
Posted 16 October 2020 - 11:31 PM
Looking like a continuation pattern so far on the monthly, like April, May and June of last year,
Oct. has to close up though.
Edited by CLK, 16 October 2020 - 11:33 PM.
Member

Posted 17 October 2020 - 06:11 AM
If you look at the quarterly time frame on SPX versus RSI there are three lower tops in RSI and Three higher tops in SPX
I think that is called a triple bearish divergence... which certainly could lead to a crash or a bear market depending on speed. And the fact that it is a quarterly chart implies at least a year of price resolution.
Also there is a certain risk that if we get a blue wave at election time it could lead to a massive one day type of crash similar to Argentina IAR index did in 2019. That was a one day 40% price crash. why? on the premise that billionaires and trillionaires will want to unload to lock in gains before the blue wave 'hits them'.
Edited by tradesurfer, 17 October 2020 - 06:12 AM.
Member

Posted 17 October 2020 - 09:30 AM
Might be helpful to take a peak at the one minute Amazon chart end of day for some weekend perspective. Gap up MONDAY on deck.
Member
Posted 17 October 2020 - 09:31 AM
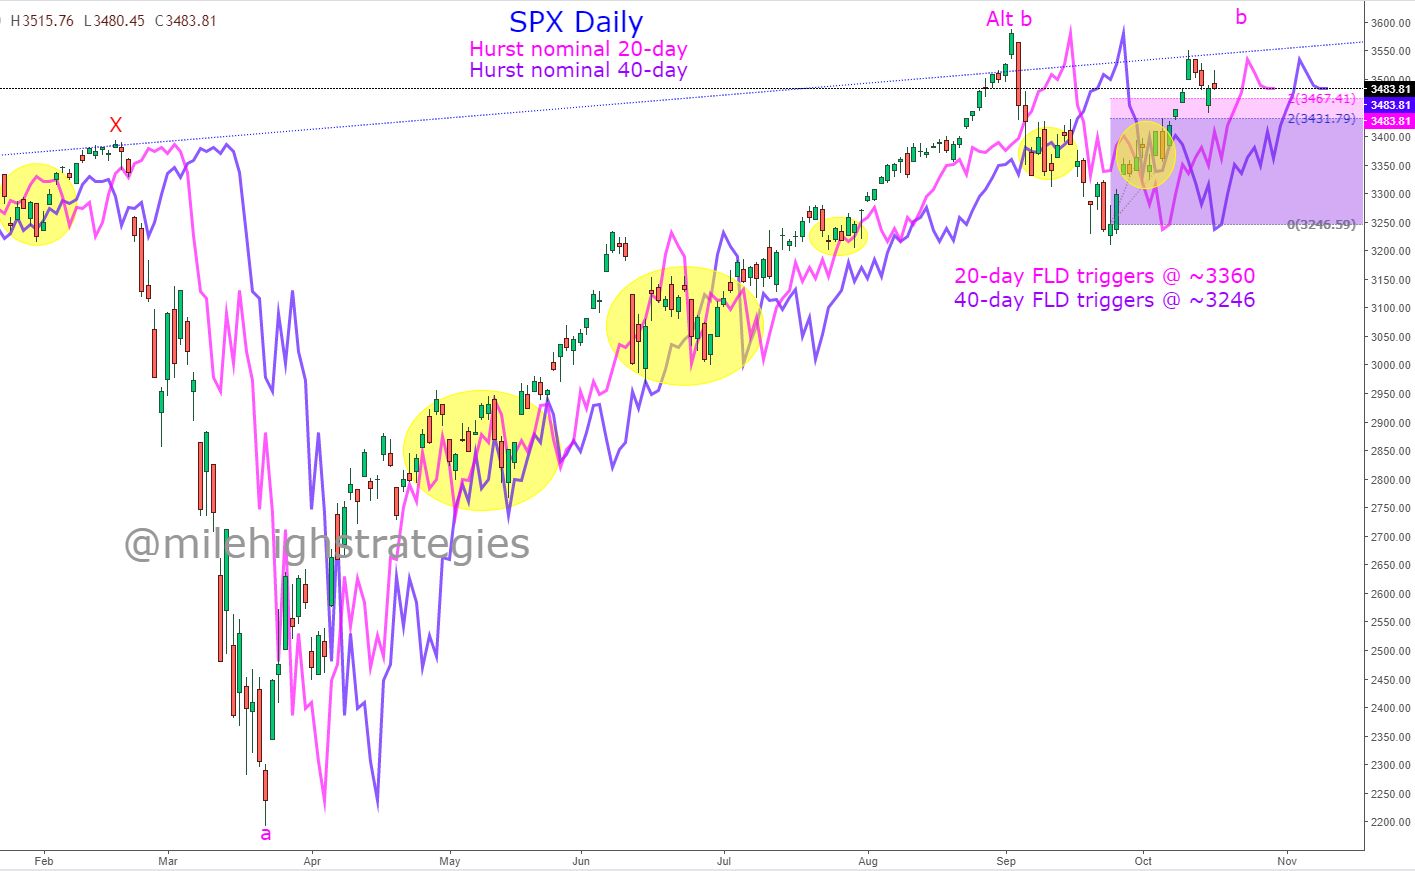
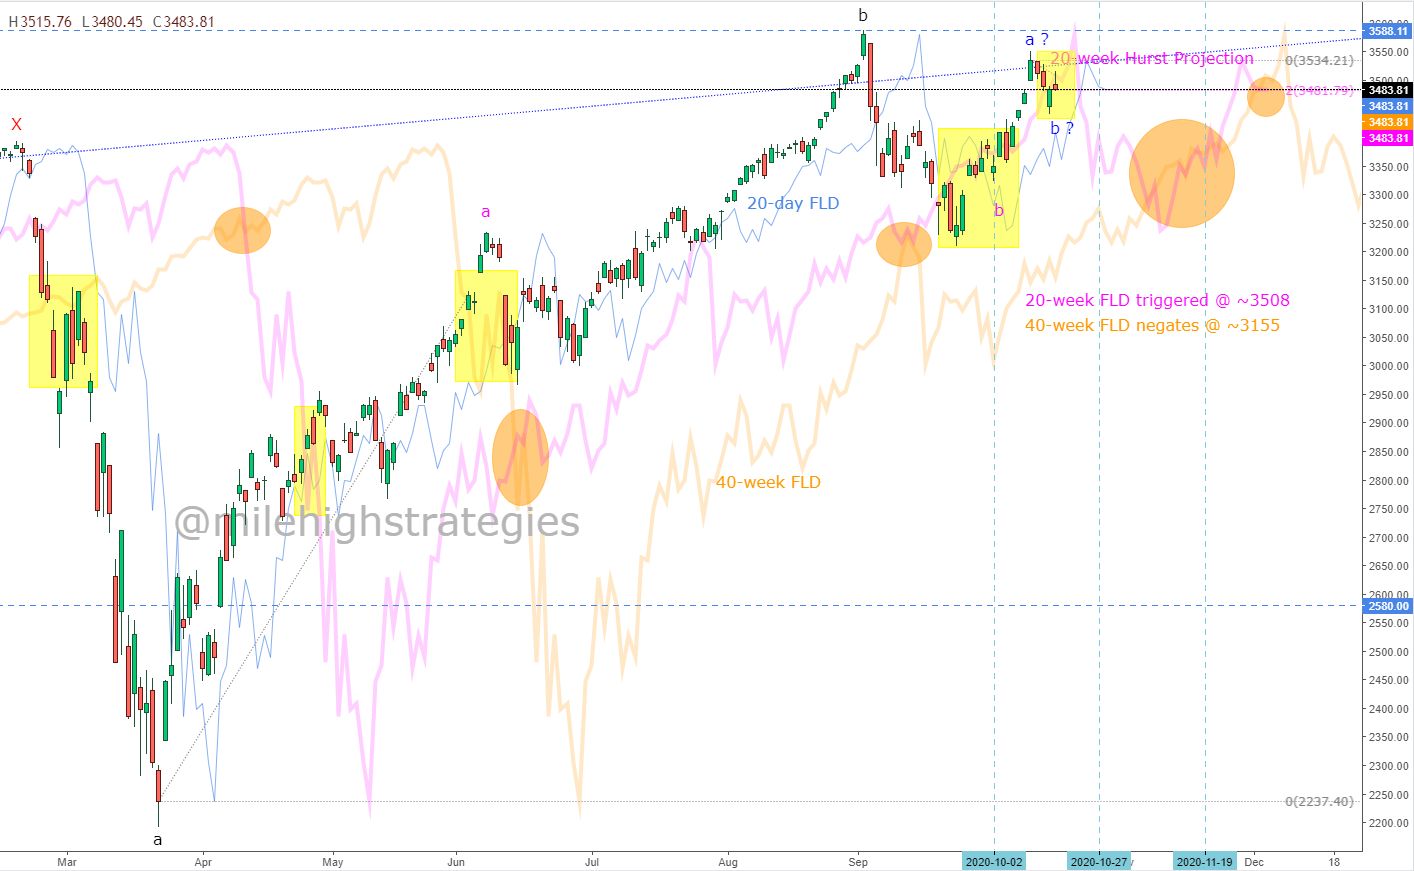
Not looking for another crash, though if my fractal interpretation is correct, the final leg down to complete wave-2 is due, yet with the majority the Hurst nominal cycles pushing upward into their respective peaks, it seems likely a choppy season is upon us - the 20-week nominal FLD was triggered in Friday's close (2nd chart), though that target has pretty much been realized at the close. Plus, there is still the higher nominal 40-week projection in the ~4008 range that has yet to be realized... twt.
Member

Posted 17 October 2020 - 12:06 PM
If you look at the quarterly time frame on SPX versus RSI there are three lower tops in RSI and Three higher tops in SPX
I think that is called a triple bearish divergence... which certainly could lead to a crash or a bear market depending on speed. And the fact that it is a quarterly chart implies at least a year of price resolution.
Also there is a certain risk that if we get a blue wave at election time it could lead to a massive one day type of crash similar to Argentina IAR index did in 2019. That was a one day 40% price crash. why? on the premise that billionaires and trillionaires will want to unload to lock in gains before the blue wave 'hits them'.
I disagree completely .... the market does not care about that. All the market cares about is the Covid going away and lots of stimuli and government spending.
Member
Posted 17 October 2020 - 01:37 PM
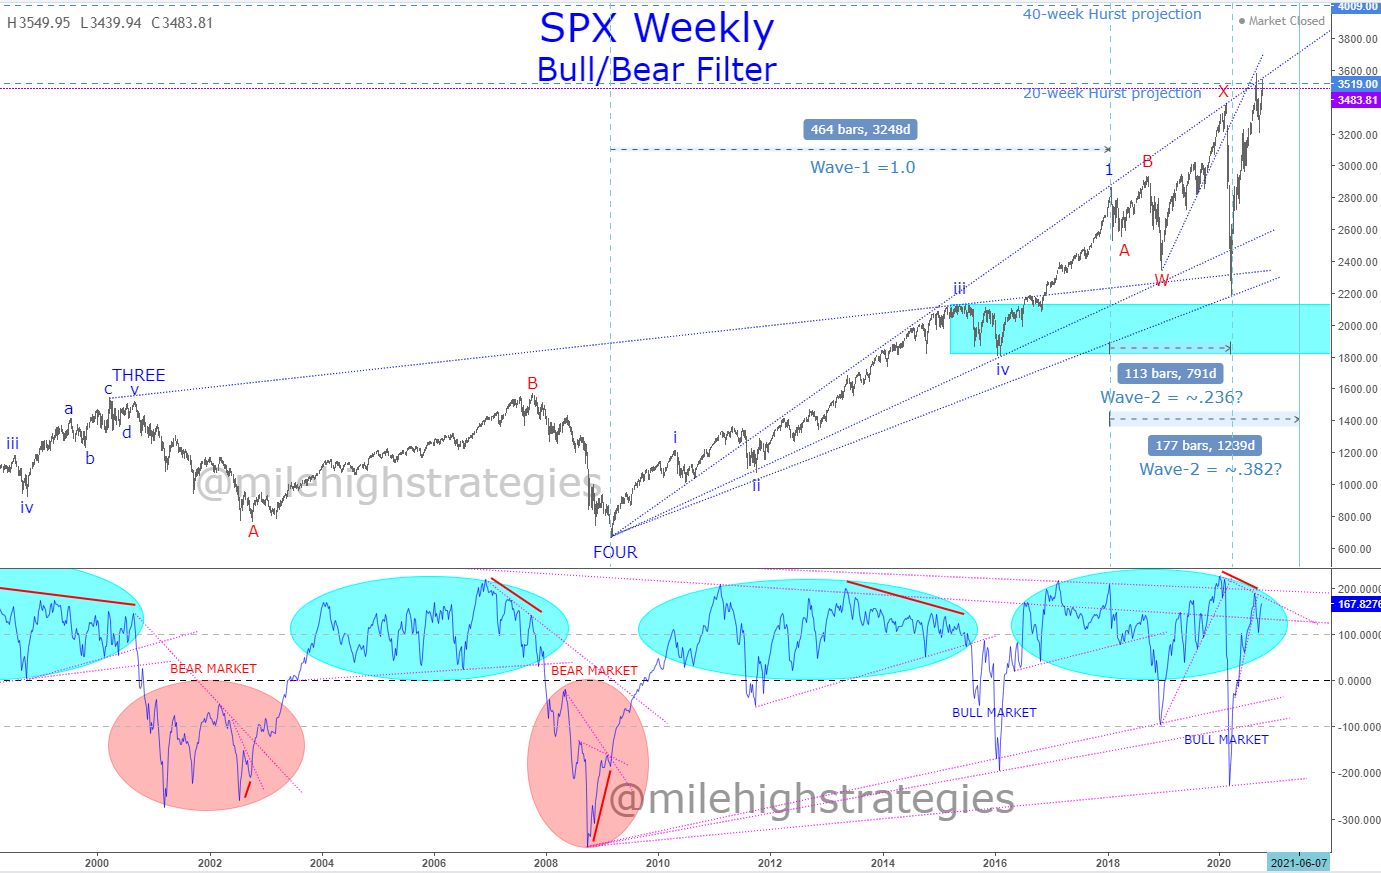
Here's the SPX weekly chart with showing two possibilities for the termination of wave-Y:2, the former is the March low, which I really don't favor (the fractal balance isn't favorable, though the time was a near-fib hit), the second time-fib would be out in June-ish, though could arrive sooner with that confluence of Hurst nominal cycle troughs in April... we shall see.
Member


Posted 17 October 2020 - 07:49 PM
From T Theory: https://ttheorygroup.science.blog/
Oct 12th:
Investment accounts are up over 200 SPX points since October 2. There is probably another 1% to go before a meaningful correction. That being said, I have removed those longs today. The risk reward is not favorable for me at this time. I do believe we will continue to rally, but a decent pullback is in order. If I were an Elliotician, I might be looking for a 1/3 pullback on this move. I would be satisfied with that.
This is not what I would call a T-Theory decision. But in the last year my use of the T-Theory chart has led to outsized gains.
Member
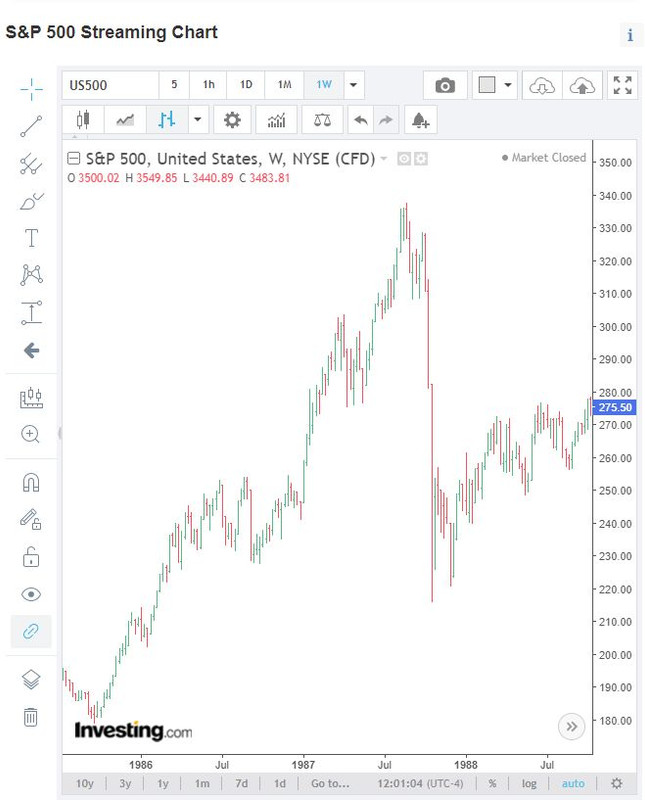
Posted 18 October 2020 - 11:02 AM
33-years ago tomorrow:
Member
Posted 18 October 2020 - 01:02 PM
Technical market report for October 17, 2020
The good news is that new highs continued their expansion, while new lows remained insignificant.
The Negatives
The seasonality estimates for next week have been historically very bad.


