When I look at the S&P chart for the last year (hit the link to my blog below), we are right at the top of the channel we've been in for the year. We've had very good earnings, but we're not pushing up. The market is richly valued on a PE basis, whether forward or trailing. You see hints of inflation, who knows if it will be temporary? If the market does not push up on good news during earnings season, what is going to happen when earnings season ends in a couple of weeks? Makes me cautious. Generally, I don't believe in "sell in May", this is about valuation, earnings and market action right now.

IT'S MAY, sell and go away!
Started by
dTraderB
, May 02 2021 04:45 PM
150 replies to this topic
#11

Rich C
-

- Traders-Talk User
- 376 posts
Member
Posted 02 May 2021 - 05:25 PM
Blogging at http://RichInvesting.wordpress.com
My swing trades typically last a couple of weeks to a couple of months.
#12
dTraderB
-
- Traders-Talk User
- 21,688 posts
Member
Posted 02 May 2021 - 05:37 PM
Tom is bearish???
Is This A "Sell On News" Top? Five Warning Signs
Tom Bowley |
May 01, 2021 at 07:00 AM
It very well could be. In my Daily Market Report (DMR) to EarningsBeats.com members on Thursday, I discussed this very possibility. I do not believe we're at any MAJOR top, but our major indices have had a significant "pre-earnings" run higher since late March and could be poised for a period of rest. Here are the five biggest warning signs I'm seeing right now.
Overbought ConditionsOverbought can remain overbought for lengthy periods, so this by itself would not make me particularly nervous. But it's definitely worth noting that the S&P 500's weekly RSI closed this week above 71. Here's the current 5-year weekly chart of the $SPX:
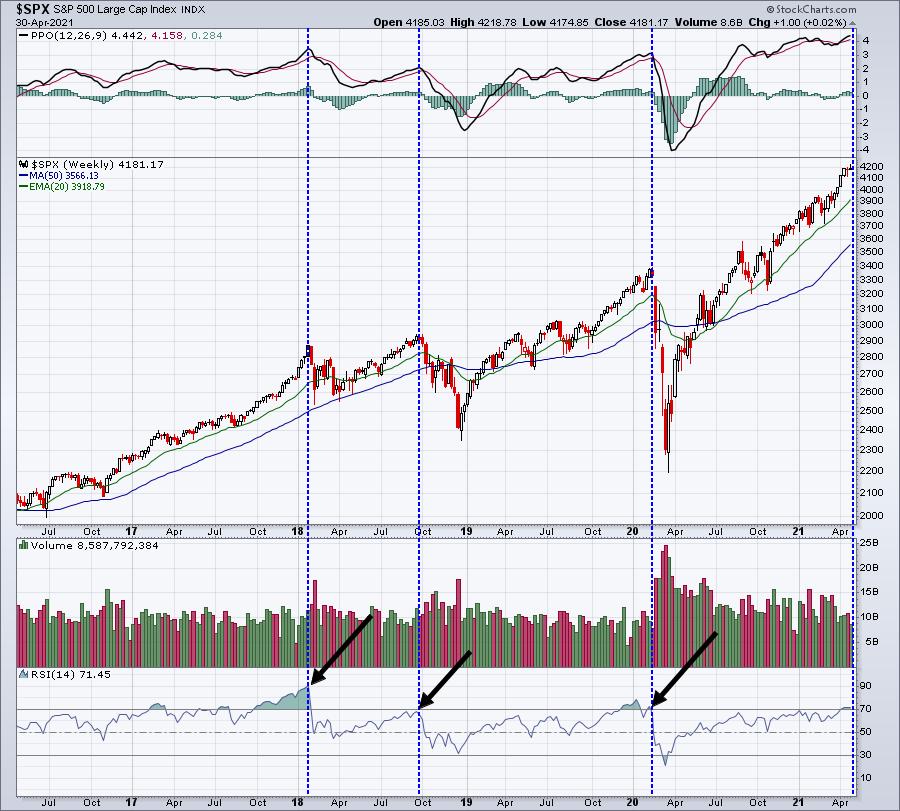
You can see that we've been overbought like this (or more) several times over the past 5 years. All of our significant tops occurred with weekly RSI readings at or above 70 (blue-dotted vertical lines). But, we've reached RSI 70 plenty of times in the past with little or no selling as a result. So while we're clearly overbought and "could" see a top, there's definitely no guarantee.
NASDAQ Failure at ResistanceAfter the bell on Wednesday, Apple (AAPL) and Facebook (FB) both reported blowout quarterly results, which led to a very strong NASDAQ open on Thursday. Sellers, however, haven't let up since that open. Here are two charts of the NASDAQ, the first a daily chart showing the price resistance and then an intraday chart showing the selling since Thursday's open:
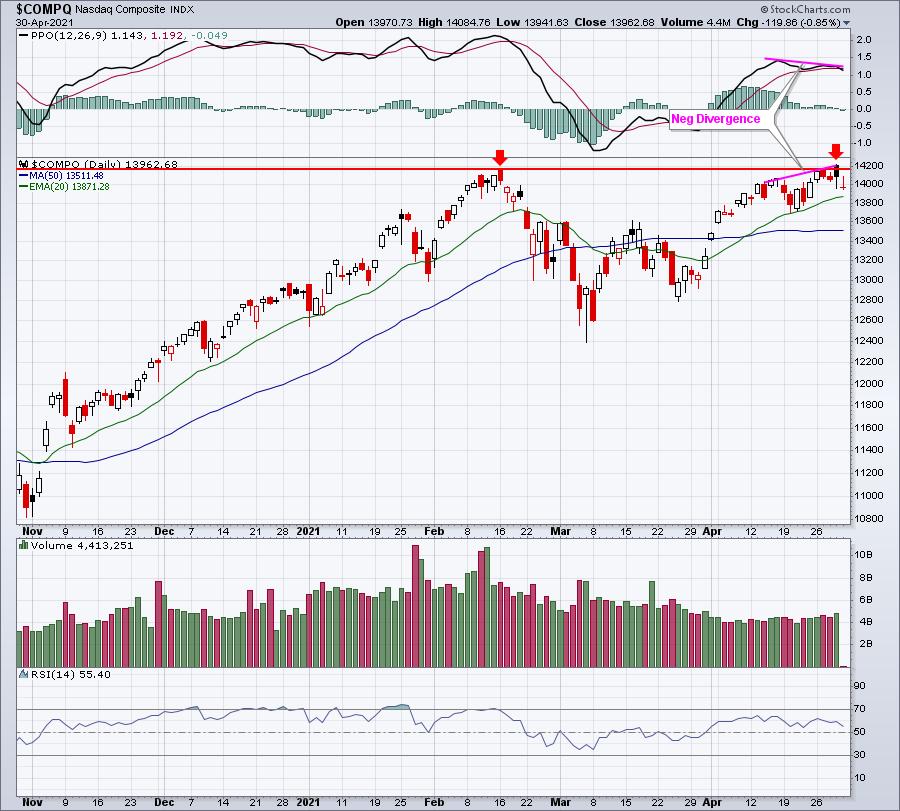
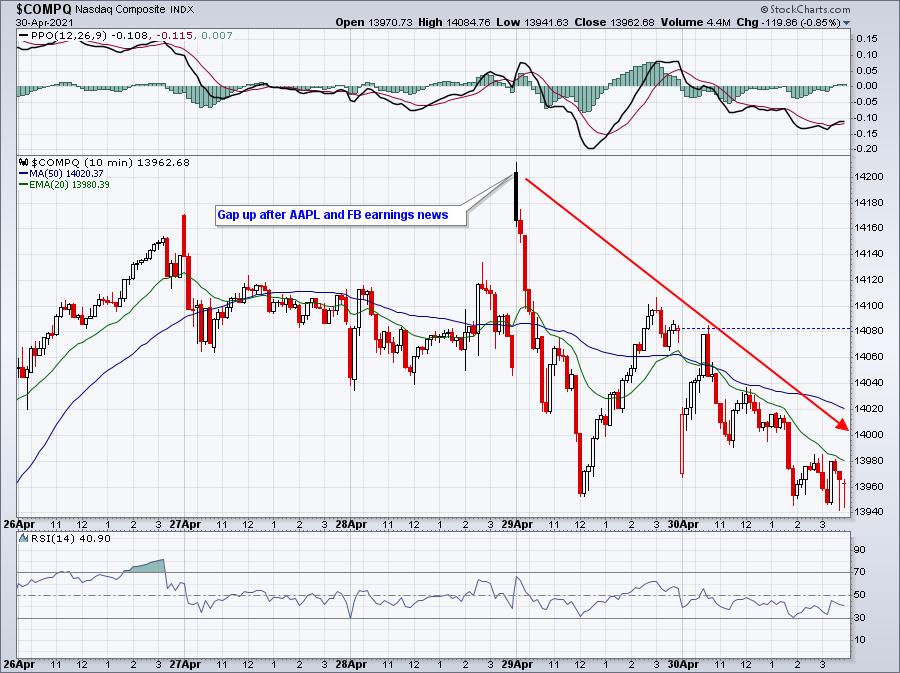
Eventually, a move back through 14,204.51 (Thursday's open) will be very bullish, but have we topped short-term? I'd say yes until proven wrong, which would include that breakout.
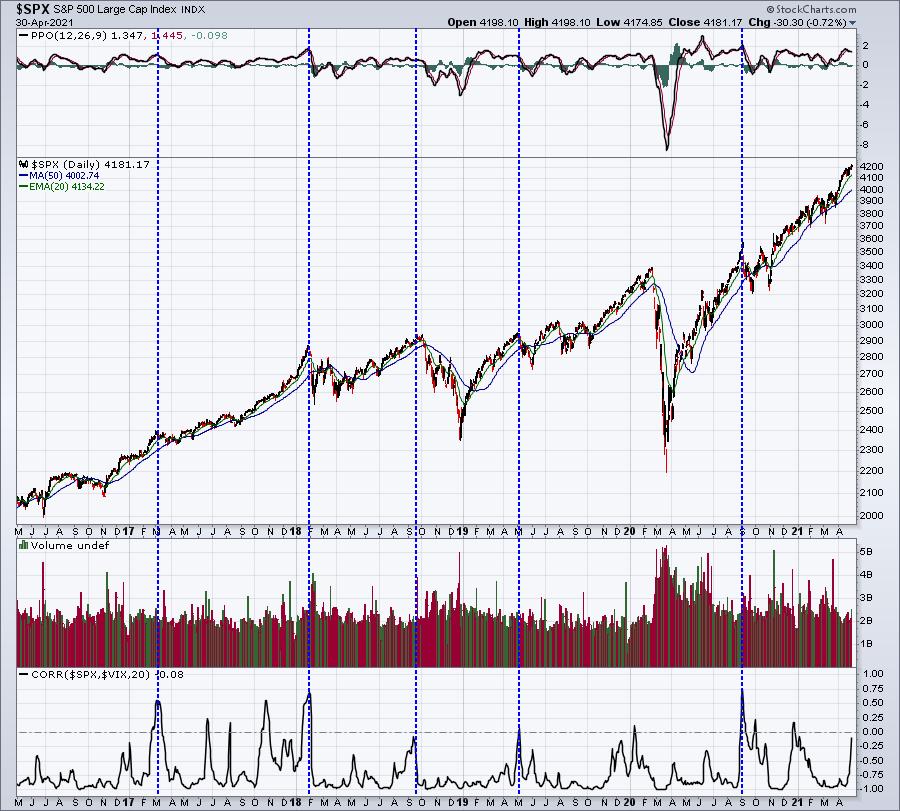
Rising VolatilityI wrote about the significance of rising stock prices accompanied by rising volatility ($VIX) back on September 3rd, just as the stock market topped. We're not quite where we were then, but we're getting close. The S&P 500 and VIX usually move opposite one another, but when that changes, we need to be aware of it. Check this out:
https://stockcharts....op-fiv-791.html
#13
dTraderB
-
- Traders-Talk User
- 21,688 posts
Member
Posted 02 May 2021 - 05:42 PM
Haven't seen this signal before.
This signal helps you spot a bear market like a pro
THE CONCEPT
The percentage of members above the 50-Day moving average risk-off model identifies instances when a low number of Index members are trading above their respective 50-day average as the Index itself hovers near a high. The model will issue two separate alerts based upon the following conditions.
CONDITIONS FOR 1ST BREADTH SIGNAL
- Percentage of S&P 500 members <= 65%
- S&P 500 Index <= 0.25% from 252-Day High
- If Condition 1 & 2, start a days since true count
- If days since true count <= ten days and the percentage of S&P 500 members crosses below 50%, signal risk-off
- If percentage of members crosses above 66%, reset condition = true
CONDITIONS FOR 2ND BREADTH SIGNAL
- Percentage of S&P 500 members <= 54.5%
- S&P 500 Index <= 0.25% from 252-day high
- If Condition 1 & 2, start a days since true count
- If days since true count <= ten days and the S&P 500 5-day rate of change is -1% or more, signal risk-off
- If percentage of members crosses above 63%, reset condition = true
CURRENT CHART
Dean calculated performance statistics in the chart as a short signal, whereas annualized returns result from buying the S&P 500. Through the spring of 2021, this signal successfully shorted the S&P 63% of the time when holding for 17 trading days.
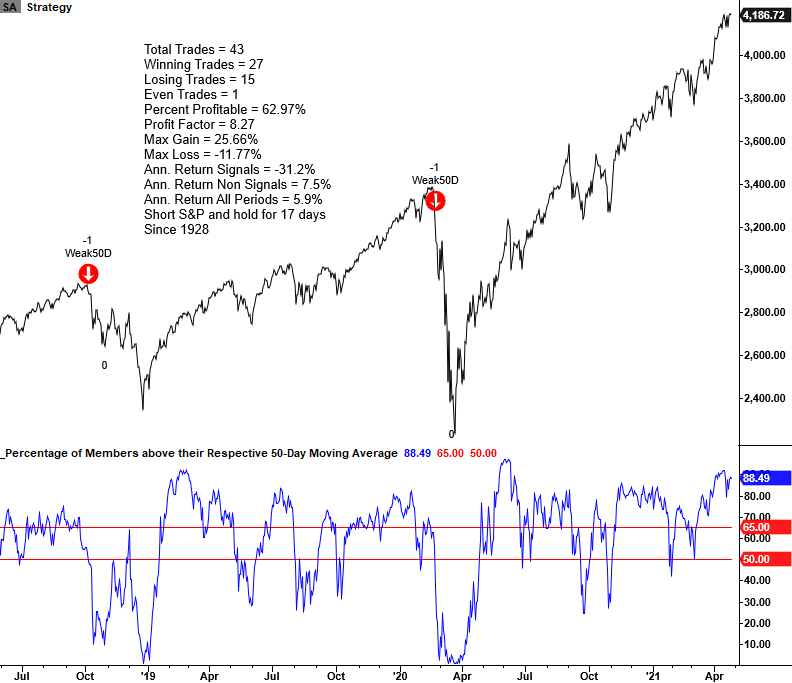
To see the full post with more details and charts, click here.
Using the percentage of members above the 50-day average has triggered ahead of several major market peaks. It wasn't perfect (nothing is), but it's a simple system, with readily available data, and triggered before 7 out of the last 10 major declines.
https://www.sentimen...rket-like-a-pro
#14
pdx5
-

- Traders-Talk User
- 9,641 posts
I want return OF my money more than return ON my money
Posted 02 May 2021 - 06:44 PM
Year 2020 was most unusual due arrival of extremely contagious brand new virus from China.
Exclude year 2020 with seasonality behavior due to the turmoil caused by covid-19.
2021 should resume normal seasonality patterns.
Edited by pdx5, 02 May 2021 - 06:45 PM.
"Money cannot consistently be made trading every day or every week during the year." ~ Jesse Livermore Trading Rule
#15
dTraderB
-
- Traders-Talk User
- 21,688 posts
Member
Posted 03 May 2021 - 06:39 AM
Closed ES HEDGE LONG +29.5 points, will add extra lot to NQ LONG DAYTRADES until ES hedge long is reopened later
Last week was much better, small profits but good intraday swings made ST trading much more profitable
Want to build a much bigger SHORT position in RISK & LT Portfolio in if it rallies to new ATHs
56 SPY PUTS
9 VXX CALLS
290 VXX LONG
1 ES HEDGE LONG 4167.25
1 NQ HEDGE LONG 13980
#16
slupert
-

- Traders-Talk User
- 3,122 posts
Member
Posted 03 May 2021 - 07:38 AM
Closed ES HEDGE LONG +29.5 points, will add extra lot to NQ LONG DAYTRADES until ES hedge long is reopened later
Last week was much better, small profits but good intraday swings made ST trading much more profitable
Want to build a much bigger SHORT position in RISK & LT Portfolio in if it rallies to new ATHs
56 SPY PUTS
9 VXX CALLS
290 VXX LONG
1 ES HEDGE LONG 4167.25
1 NQ HEDGE LONG 13980
I closed all futes for now in premarket. 10am PMI, lets see if good news is still good news, or they get spooked about a market too hot. (JMHO)
#17
12SPX
-

- Traders-Talk User
- 16,131 posts
Member
Posted 03 May 2021 - 07:57 AM
Guess I should have held that long over the weekend but that's ok got my extreme fills overnight while I slept, average short now 4191. I like the comments about strong earnings and the Nasdaq closing down on the week as this move still needs to take a break. Although the overall market p/e ratio is only sitting around 45 lol, at the least I think volatility will kick up again and any day we could wake up to a -5% decline because of it. In the back of my mind I keep thinking about Cat that now has a p/e ratio of 37. When did that happen or should I say when did that become normal because it isn't as far as I remember! Do think May is going to be an interesting one especially after April seeing a +5% return anyhow with extreme sentiment in options and overboughtness. We're either gonna continue this move to a +50% move for the year or settle down and see some volatility this month. Think that'll be the case.
#18
12SPX
-
- Traders-Talk User
- 16,131 posts
Member
Posted 03 May 2021 - 08:31 AM
Had to add couldn't resist the pop at the end here, average short 4194!
#19
12SPX
-
- Traders-Talk User
- 16,131 posts
Member
Posted 03 May 2021 - 08:40 AM
Profit stop 4193, start a sell build right above....
#20
12SPX
-
- Traders-Talk User
- 16,131 posts
Member
Posted 03 May 2021 - 08:43 AM
And bam out for a 1 point profit and starting a new short build at 4196, would love 4200!


