Jump to content


Photo

High Yield Bonds a Tell


  • Please log in to reply
7 replies to this topic

#1 ds

ds

    Member

  • Traders-Talk User
  • 70 posts

Posted 08 October 2021 - 06:15 PM

I haven't posted here since millennials were in strollers, but I always check here every morning.  Lately it has been noted that there are divergences between the VIX and McOsc with Stock price as an indication that maybe the market is stronger than price indicates.  However I have noticed that Junk Bonds (ie. JNK) are behaving weaker than stock price, and have not recovered recently with stock.  Is Junk telling us that the Economy is weakening and that debt on the margins is going to have trouble meeting it's obligations, particularly if rates rise and Fed accommodation ends?


Also, I have shared links that have been posted here by K-Wave, The Chief, and others regarding Covid with my Wife who is an adamant anti-vaxxer, and a fan of Hydroychlorquine and Ivermectin.  As a kindred spirit with the skepticism evident on this blog she asked me to post the following video: 


The only link I can think of between Junk bonds and vaxxing is that the religous fervor with which vaxxing is being proscribed on the American public may end up slowing the economy down.


"What have I done?" - Colonel Bogey

#2 Rogerdodger

Rogerdodger

    Member

  • TT Member*
  • 26,870 posts

Posted 08 October 2021 - 06:40 PM

CNN Fear 7 Greed Index


Junk Bond Demand
Extreme Greed

Investors in low quality junk bonds are accepting 1.90 percentage points in additional yield over safer investment grade corporate bonds. While this spread is historically high, it is sharply lower than recent prices and suggests that investors are pursuing higher risk strategies.


Last changed Sep 20 from a Greed rating


Edited by Rogerdodger, 08 October 2021 - 06:48 PM.


#3 pdx5

pdx5

    I want return OF my money more than return ON my money

  • Traders-Talk User
  • 9,527 posts

Posted 08 October 2021 - 10:19 PM

Above 2 posts conflict with each other?

1st post says junk bonds are weakening. That implies lower prices and higher yields.

2nd post says yield on junk is sharply lower than recent prices. Which implies higher junk bond prices.

Can someone clarify?


"Money cannot consistently be made trading every day or every week during the year." ~ Jesse Livermore Trading Rule

#4 Douglas

Douglas

    Member

  • Traders-Talk User
  • 1,827 posts

Posted 09 October 2021 - 02:06 AM

ds, please post a plot of what you are seeing vis-a'-vis junk bond relative weakness.  The first plot below appears to show recent comparable weakness in both the junk bond (JNK) and equity (SPY) funds at least to the my naked eye.  The second plot below appears to show greater recent weakness in the "good" TLT treasury debt than in the "bad" JNK debt which is a bit confusing.  What would posses traders to keep the trash and throw out the silverware?  I'm confused which unfortunately is my normal condition these days.  Anything that you can do to reduce my pixilated state would be greatly appreciated.


NRjBq4f.png


OIBq2FB.png


Regards,

Douglas


#5 fib_1618

fib_1618

    Member

  • Traders-Talk User
  • 10,145 posts

Posted 09 October 2021 - 06:32 AM

Above 2 posts conflict with each other?

1st post says junk bonds are weakening. That implies lower prices and higher yields.

2nd post says yield on junk is sharply lower than recent prices. Which implies higher junk bond prices.

Can someone clarify?


I'll throw this one up there for digestion...data through October 1st.


Remember...breadth leads price.


Fib


ltjunk100121.png

http://www.technical...tjunk100121.png


Better to ignore me than abhor me.

“Wise men don't need advice. Fools won't take it” - Benjamin Franklin


"Beware of false knowledge; it is more dangerous than ignorance" - George Bernard Shaw


Demagogue: A leader who makes use of popular prejudices, false claims and promises in order to gain power.

Technical Watch Subscriptions


#6 pdx5

pdx5

    I want return OF my money more than return ON my money

  • Traders-Talk User
  • 9,527 posts

Posted 09 October 2021 - 07:47 AM

ds, please post a plot of what you are seeing vis-a'-vis junk bond relative weakness.  The first plot below appears to show recent comparable weakness in both the junk bond (JNK) and equity (SPY) funds at least to the my naked eye.  The second plot below appears to show greater recent weakness in the "good" TLT treasury debt than in the "bad" JNK debt which is a bit confusing.  What would posses traders to keep the trash and throw out the silverware?  I'm confused which unfortunately is my normal condition these days.  Anything that you can do to reduce my pixilated state would be greatly appreciated.


NRjBq4f.png


OIBq2FB.png


Regards,

Douglas

Those are very useful charts to see what is going on with junk in relationship to TLT.

What I surmise from that is that investors are desperate for yield, and are willing to buy riskier stuff.


"Money cannot consistently be made trading every day or every week during the year." ~ Jesse Livermore Trading Rule

#7 MikeyG

MikeyG

    Member

  • Traders-Talk User
  • 2,850 posts

Posted 09 October 2021 - 03:05 PM

JNK monthly chart looks fine to me.


The bull in stocks will continue! 


mdgcapital@protonmail.com  

papilioinvest.com

@papilioinvest


"One soul is worth more than the whole world." 


#8 ds

ds

    Member

  • Traders-Talk User
  • 70 posts

Posted 09 October 2021 - 11:50 PM

ds, please post a plot of what you are seeing vis-a'-vis junk bond relative weakness.  The first plot below appears to show recent comparable weakness in both the junk bond (JNK) and equity (SPY) funds at least to the my naked eye.  The second plot below appears to show greater recent weakness in the "good" TLT treasury debt than in the "bad" JNK debt which is a bit confusing.  What would posses traders to keep the trash and throw out the silverware?  I'm confused which unfortunately is my normal condition these days.  Anything that you can do to reduce my pixilated state would be greatly appreciated.


NRjBq4f.png


OIBq2FB.png


Regards,

Douglas

I should point out that my observation on Junk is very early tea leaf reading, but I think Douglas' charts make the point.  There are two recent periods where JNK begins to diverge from SPX, early August and possibly NOW.  In early August SPX rose while JNK sank or treaded water, this was coincidental to a period in August where TLT spiked twice (indicating easing of rates and possibly weak economic numbers).  SPX likes the easing, but JNK gets nervous when the economy seems weak.  But now in October commodoties (ie. DBC) are soaring so interest rates move up sharply, but the economy still seems tepid (read Jimmy Carter stagflation).  I think Junk bonds are just beginning to get nervous about the economy and maybe ripples from Evergrande, irrespective of the direction of interest rates. 


With regard to the silverware analogy, personally I am much more comfortable in general with Junk than TLT because of the magnified interest rate sensitivity of TLT, but that would end if JNK begins to plummet in an economic downturn.


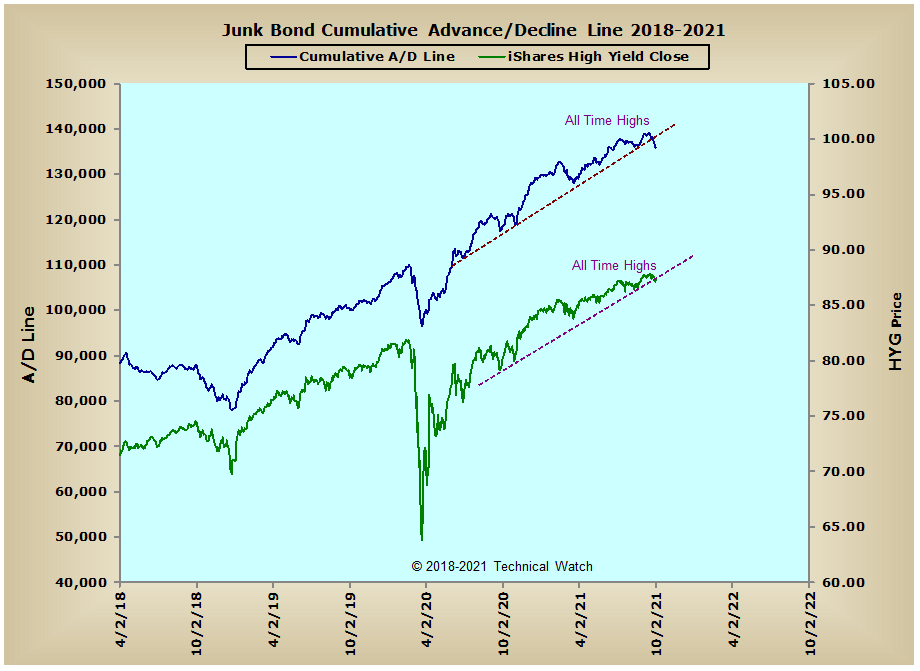
I'm not sure where FIB holds on this, but the way I read his chart, breadth for Junk was weakening and broke a supporting trend line, and if AD leads Price then it implies Price will follow and weaken.


Sorry not up on the technology of uploading charts, last time was over a decade ago.  I took a chance and threw in a TA observation so I could post my Wife's video of Dr. McCullough, welcome to the lion's den of accountability.  I think we need to keep a close eye on JNK.


"What have I done?" - Colonel Bogey