Technical Review – The Bullish View
There are currently several bullish arguments to support a rally. While price action remains weak, the S&P 500 holds short-term support. At the same time, sentiment remains extremely “bearish,” which, from a contrarian perspective, is actually “bullish.”
Such was a point made on Thursday via Yahoo Finance:
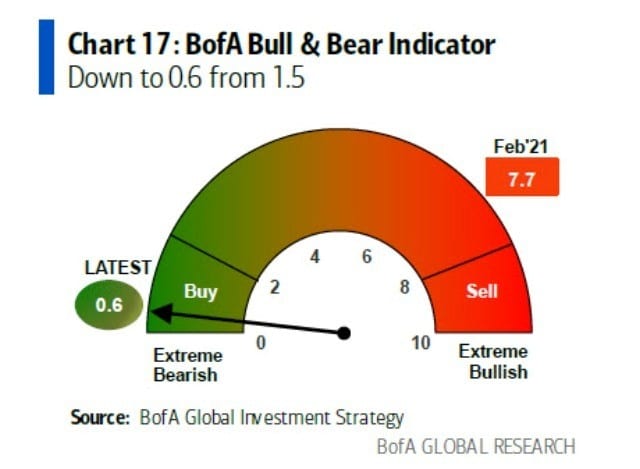
“Michael Hartnett’s team over at Bank of America Global Research noted their proprietary Bull & Bear indicator swung into contrarian buy mode a few weeks ago. But Hartnett still leans bearish, arguing that U.S. stocks are ‘vulnerable’ to a bear market rally and that traders should ‘sell any rips.'”

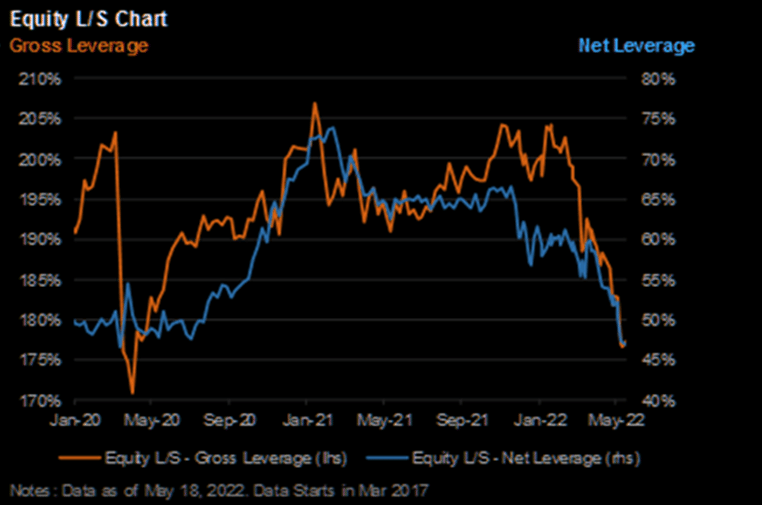
Concurrently, Hedge Fund leverage has gotten sharply reduced. As Morgan Stanley noted, last week ended with one of the most significant gross reductions. That happened on both the long and the short sides of their books.

With June wrapping up the second quarter of 2022, it is very likely that between the selloff in both stocks and bonds this year, many fund managers are “out of balance” regarding their allocations. Such could provide decent buying pressure to align allocations by quarter-end.
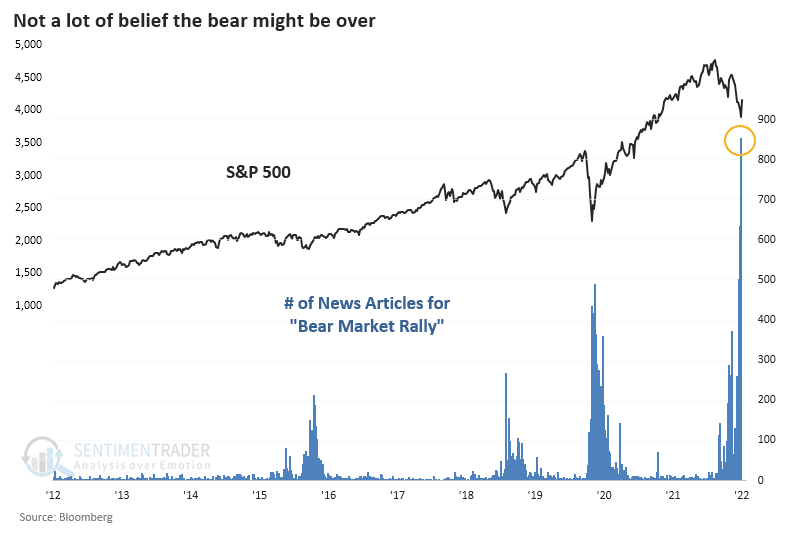
Lastly, as noted by Sentiment Trader previously:
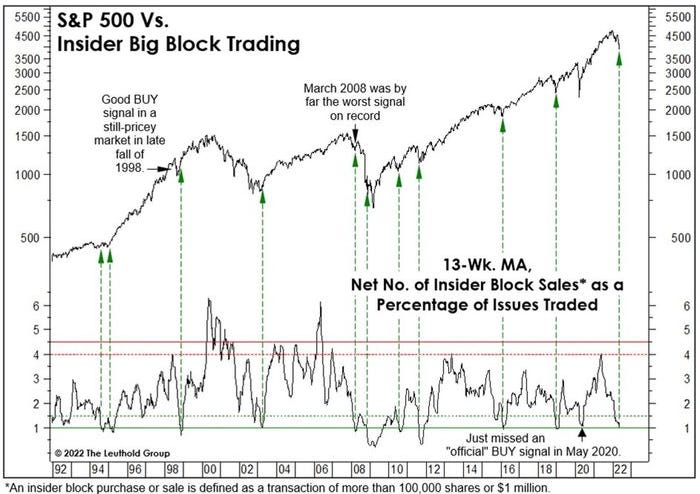
“In late March 2020, thrusts in buying interest were wildly impressive. But almost all technicians mocked them as ‘unofficial’ because they didn’t meet some arbitrary, cherry-picked, overly optimized rules. It’s happening again, and there is even more skepticism that this rally is real. The number of articles dismissing the gains as just another “bear market rally” is nearly double the prior record from early April 2020.
In the three days leading up to the exchange holiday, more than 80% of volume on the NYSE flowed into advancing stocks. We typically do not see this kind of behavior during bear markets, usually at the end of them.“

Market Fails At First Resistance
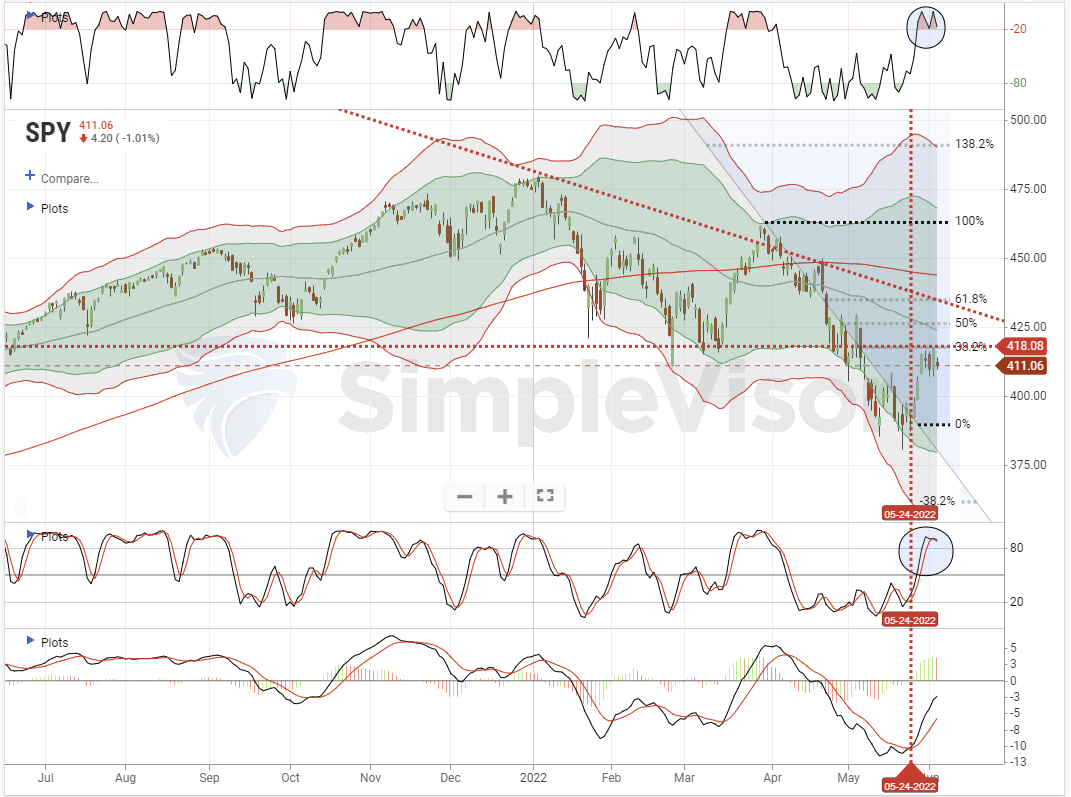
As discussed last week, a rally finally took hold as investors found reasons to be bullish. That rally pushed the market above the 20-dma and triggered a reasonably strong “buy” signal. However, despite the optimism of the bulls, we noted an essential headwind to the rally. To wit:
“Concerning how long it will last, I suspect the rally could be powerful but short-lived as a tremendous number of investors swept up during the decline and are looking for a sellable rally. Such is a continuation of investor actions so far this year. For the most part, the 20-dma has consistently acted as the “exit” for ‘trapped longs.’”
While the market did clear the 20-dma, the “trapped longs” headed to the exits at the initial 38.2% Fibonacci retracement level from the March highs. That level was also where previous important support for the February and April lows got broken.

We technically review this chart again in a moment, but the critical point is that if the market doesn’t advance early next week, we will likely retest the recent lows.
As I discussed with Charles Payne on Friday, the problem I have is that we are trapped between a market that, from a sentiment view, is “so bearish, it’s bullish.” However, we are also facing an aggressive rate hiking campaign and the start of “QT” by the Fed.
https://realinvestme...-where-to-next/