Oversold with 1 hell of an accum,/distr. divergence,obv isn't too pretty though Would love to see a puke at the opening Might be good for a trade on the long side. (JMHO)

Member
Posted 24 September 2022 - 09:10 AM
Oversold with 1 hell of an accum,/distr. divergence,obv isn't too pretty though Would love to see a puke at the opening Might be good for a trade on the long side. (JMHO)
Member

Posted 24 September 2022 - 11:49 AM
Weekly chart to me look like it is just about to re-engage downside...
IF that 200 week MA that Qs have been riding since 2010 does give way....MASSIVE Air Gap in that long term chart...
Watching to see if Price collapses from here and gets the momo roaring back to the downside after the turn back down below Zero (a potentially VERY dangerous pattern)

As an example of what can come from this momo configuration, here is a daily NFLX in a similar spot. Obviously, I do not expect an index to crash that hard after the 200 failure, but could see horrific decline if the 200 does give way soon.

This all comes down to the Mega Caps here on Qs
The stuff I am looking at is suggesting the Big Caps could be just about to rollover in a big way.
We have already seen massive destruction in SO MANY other stocks, and now we have an absolute disaster from FDX, which more than any other stock, should be a pretty good indicator of how economy is actually doing...before those companies that use its services report their own disasters in the upcoming weeks.
So the question is, Do Ya Feel Lucky for the upcoming earnings season? Well Do Ya?
And NYA, a much broader index has already busted the 200 week with a sharper momo turn back down already in progress...Below that Yellow line...Katy Bar The Door bear market on our hands...

The strength of Government lies in the people's ignorance, and the Government knows this, and will therefore always oppose true enlightenment. - Leo Tolstoy
Member
Posted 24 September 2022 - 12:23 PM
Sepakin' of Harbingers....
We may get another one on Monday.
PAYX....and that chart is looking pretty toppy...
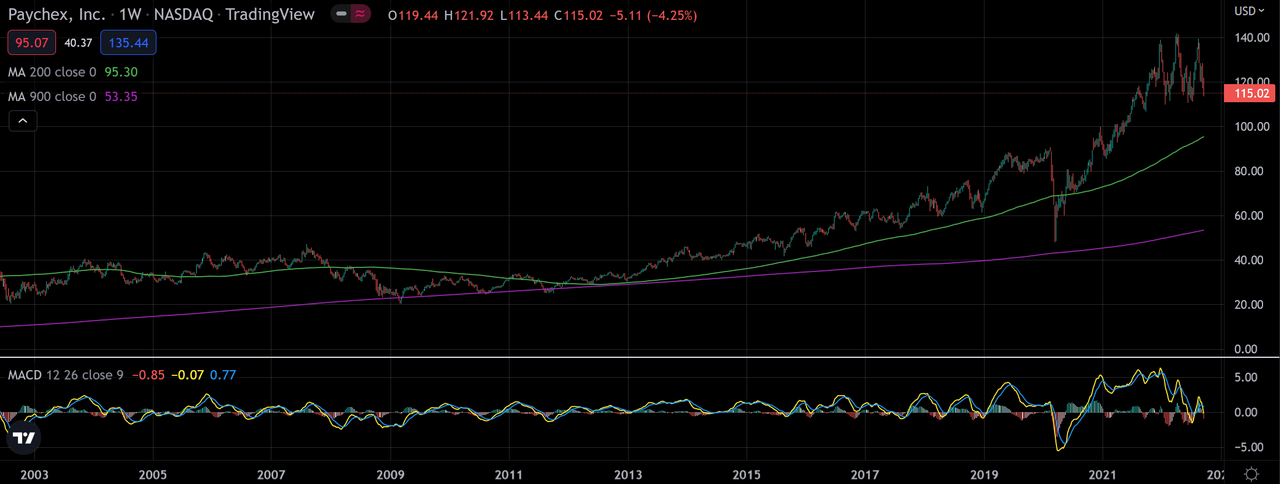
The strength of Government lies in the people's ignorance, and the Government knows this, and will therefore always oppose true enlightenment. - Leo Tolstoy
Member
Posted 24 September 2022 - 12:27 PM
CTAS another potential harbinger on Monday...also looking pretty toppy...
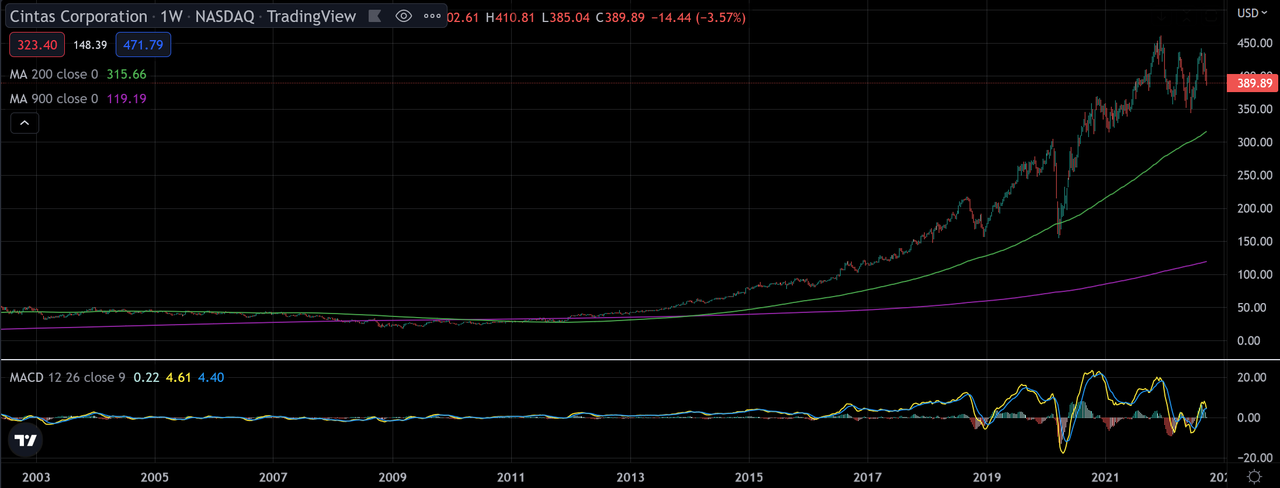
The strength of Government lies in the people's ignorance, and the Government knows this, and will therefore always oppose true enlightenment. - Leo Tolstoy
Member


Posted 24 September 2022 - 12:36 PM
Is superman still long?
New lows increased to extreme crashworthy numbers last week.
Positives are pretty hard to find.
Investors are beginning to realize the FOMC is serious about raising rates and draining liquidity.
Average returns for the coming week have been negative by all measures.
Edited by Rogerdodger, 24 September 2022 - 12:50 PM.
Member
Posted 24 September 2022 - 06:42 PM
Weekly chart to me look like it is just about to re-engage downside...
IF that 200 week MA that Qs have been riding since 2010 does give way....MASSIVE Air Gap in that long term chart...
Watching to see if Price collapses from here and gets the momo roaring back to the downside after the turn back down below Zero (a potentially VERY dangerous pattern)
As an example of what can come from this momo configuration, here is a daily NFLX in a similar spot. Obviously, I do not expect an index to crash that hard after the 200 failure, but could see horrific decline if the 200 does give way soon.
This all comes down to the Mega Caps here on Qs
The stuff I am looking at is suggesting the Big Caps could be just about to rollover in a big way.
We have already seen massive destruction in SO MANY other stocks, and now we have an absolute disaster from FDX, which more than any other stock, should be a pretty good indicator of how economy is actually doing...before those companies that use its services report their own disasters in the upcoming weeks.
So the question is, Do Ya Feel Lucky for the upcoming earnings season? Well Do Ya?
And NYA, a much broader index has already busted the 200 week with a sharper momo turn back down already in progress...Below that Yellow line...Katy Bar The Door bear market on our hands...
II've been saying maybe just a quick bounce then back down.
Member
Posted 24 September 2022 - 06:49 PM
I posted this before on midterm years it looks like rallys won't start until after an election But seriously, look at all those end of the year charts of the "grind" When Wall St wants to get paid they get paid.
Market Barometer – Alvarez Quant Trading
Member

Posted 25 September 2022 - 08:27 PM
"However, what was perhaps the most notable market feature of Friday's (orderly) selloff is the record surge in hedging: while call buying has collapsed, Friday saw the highest put option volume in historyat just shy of 34 million contracts.
Member

Posted 25 September 2022 - 10:19 PM
I think we are about to go down really really hard. Yes we are already deeply oversold but...
we could see VIX spike to 90 to 100 range
Edited by tradesurfer, 25 September 2022 - 10:20 PM.


TTHQ Directory →
Fearless Forecasters →
Can't miss these negative divergences,Started by slupert , 30 May 2025 |
|

|
||
TTHQ Directory →
Fearless Forecasters →
Gap fill at the 50?Started by slupert , 19 Jul 2024 |
|
|
||
TTHQ Directory →
Fearless Forecasters →
Down evry Friday in April,Started by slupert , 28 Apr 2022 |
|
|
||
TTHQ Directory →
Fearless Forecasters →
Q's almost there?Started by slupert , 18 Jan 2022 |
|
|
||
TTHQ Directory →
Fearless Forecasters →
Doesn't look right to me,Started by slupert , 05 Aug 2021 |
|

|

