I also show VIX momo turning positive ( or I guess negative :-) ) ..here' simple signal I use part of my Volatility model .
Overall model shows we are 'trying' to make an IT low ..but the setup is not good and I expect a failed attempt over this and next week though
i'd like to be wrong and we get a big bounce.
Can't seem to get this image to show ....but here is link.
https://mark_davidson1-yahoo.tinytake.com/msc/NzQ3MjI2M18yMDM4NzkzNg
IF that turn back up does not mainfest...crashes happen on violation of support that no one thinks can be Broken...AKA last Thursday low.
If we are below that low from here forward going into the weekend....sure would line up with the Dark Days....woo woo
Anyway, if this overnight action on TSLA sticks, and breaks below the lows tomorrow..be very careful going into the weekend.
Yes Kwave - a failure of the current low on historical backtest of my model, would give a pattern setup only seen approximately 4 times in 100 years, and was extremely bearish longer term in those cases.
A failure would likely not be immediate though, and take a few weeks with multiple attempts to hold this Key 3400-3500 pivot. Essentially that setup without going into all the conditions is a 'failure to make an
IT low' at this point in a bear market. My model is giving very high odds that will be the case here as said over next week or so but i'd expect more attempts to hold that pivot if/when we retest it that is
part of the pattern setup.
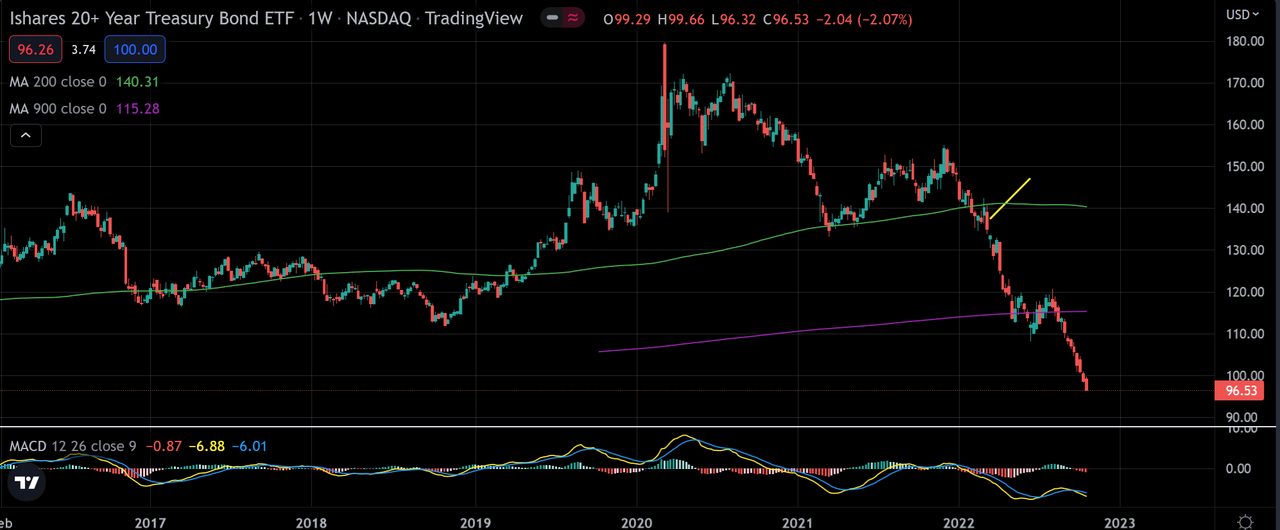
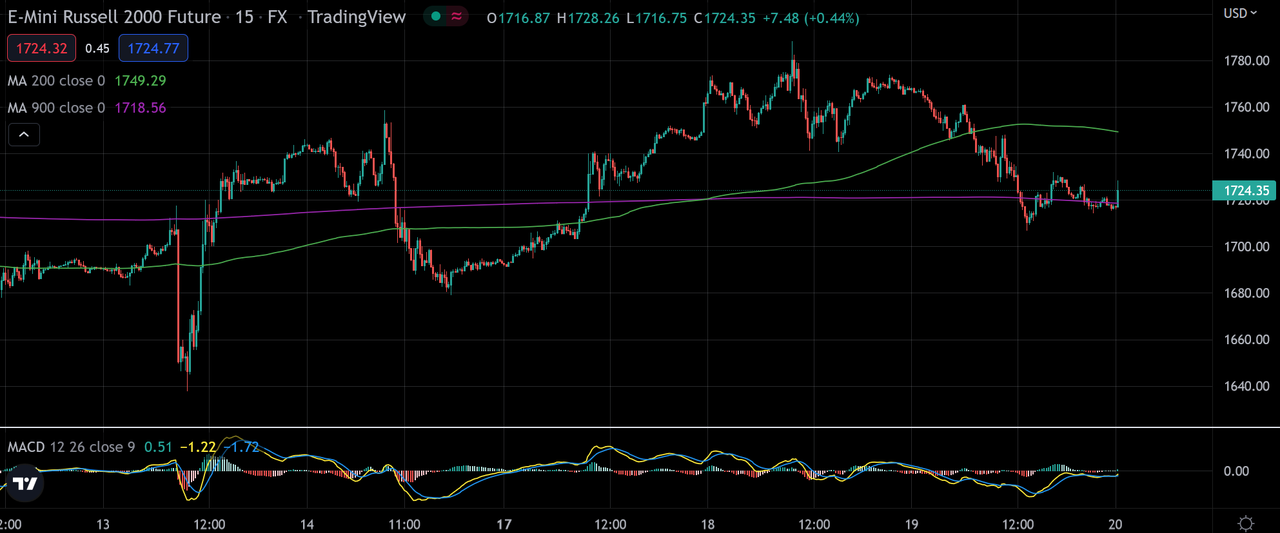
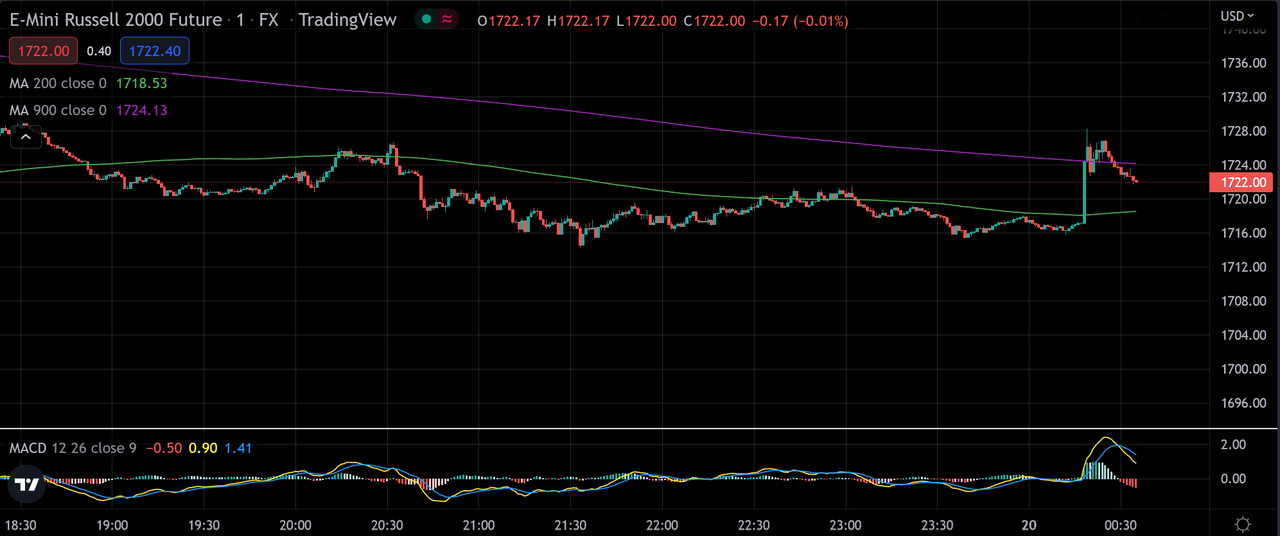
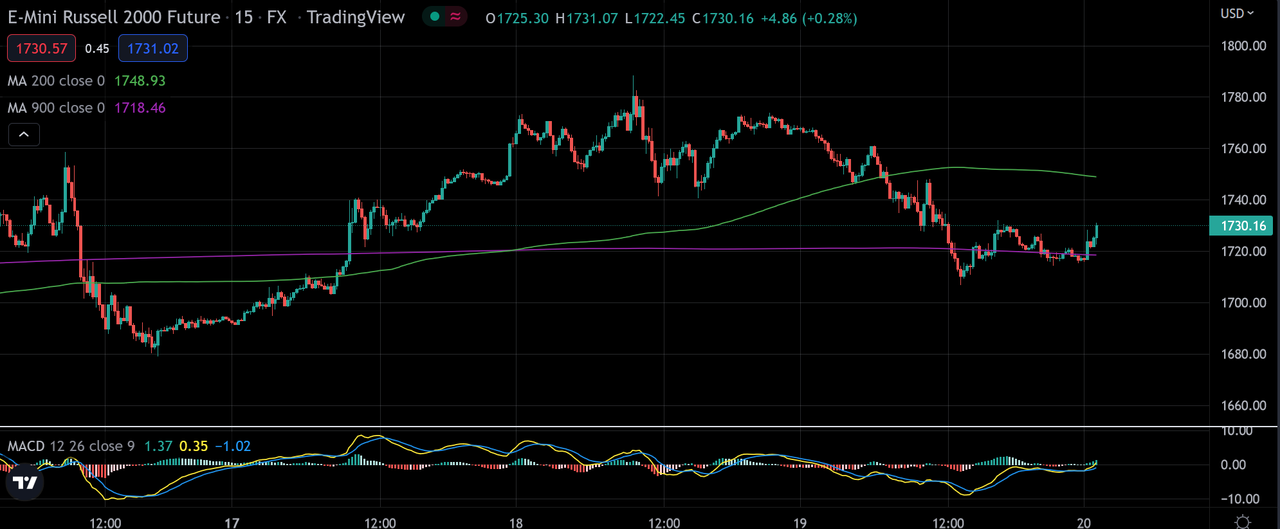
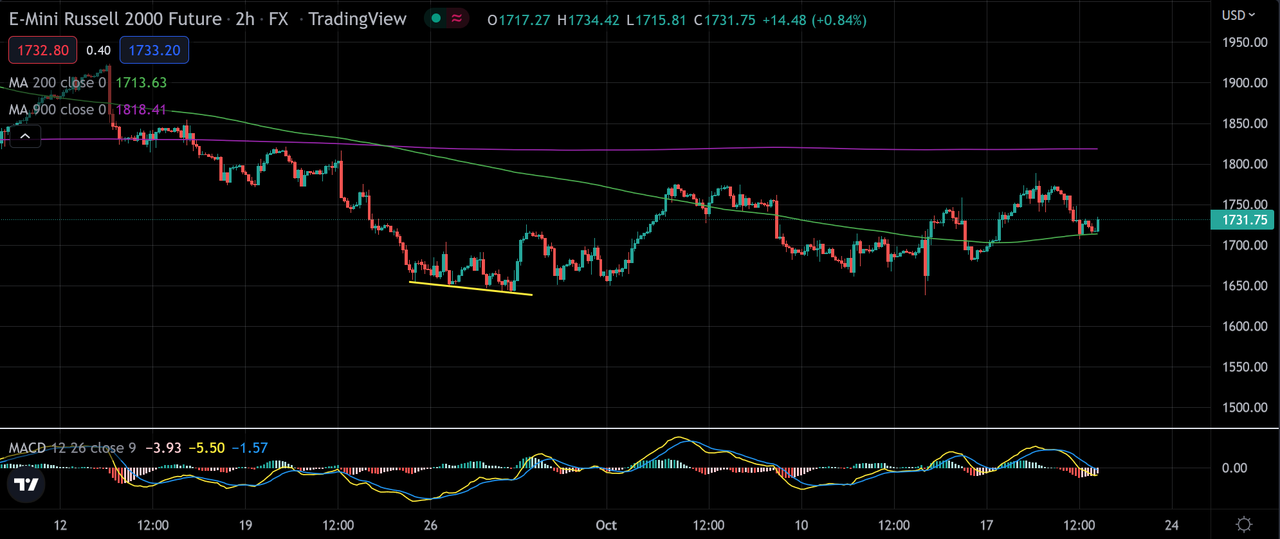
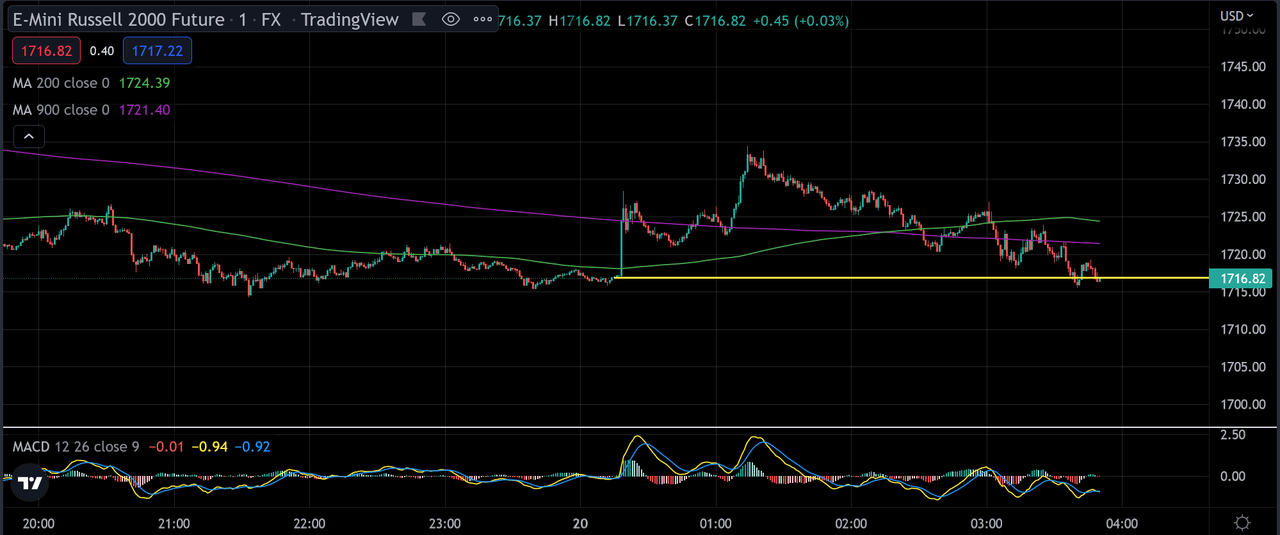
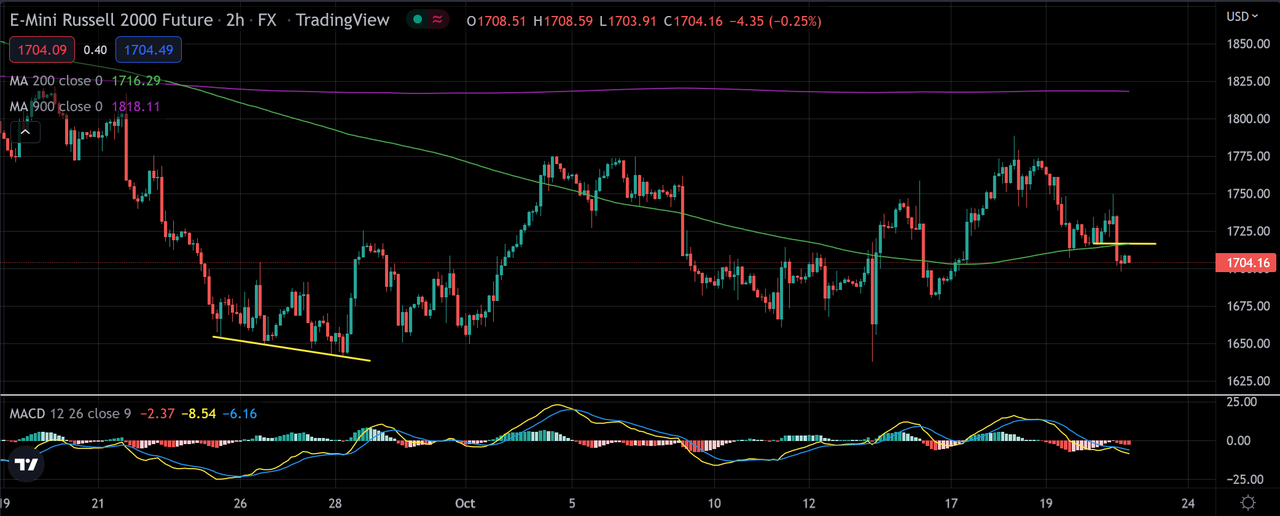
The main reason that I think it could possibly come faster, as perhaps a multi-week, "crash" is RUT.
That one has already done a lot of work under the 200 week, with that huge air gap underneath in the weekly chart.
As you say, very rare setup, but IF a "crash" on the weekly charts is a comin', this is exactly the type of place it would occur.
Am not ruling out something along these lines if Thursday low is busted. Extreme, but certainly not impossible as the biggest funny money bubble in the history of the world implodes.

Edited by K Wave, 19 October 2022 - 10:41 PM.