BULLISH chart but this is a very slow one, it has double-bottomed, the big move up from this will be in 2023 Q1, I think....
BONUS CHART >> got to include a goody for the goodies who subscribed.
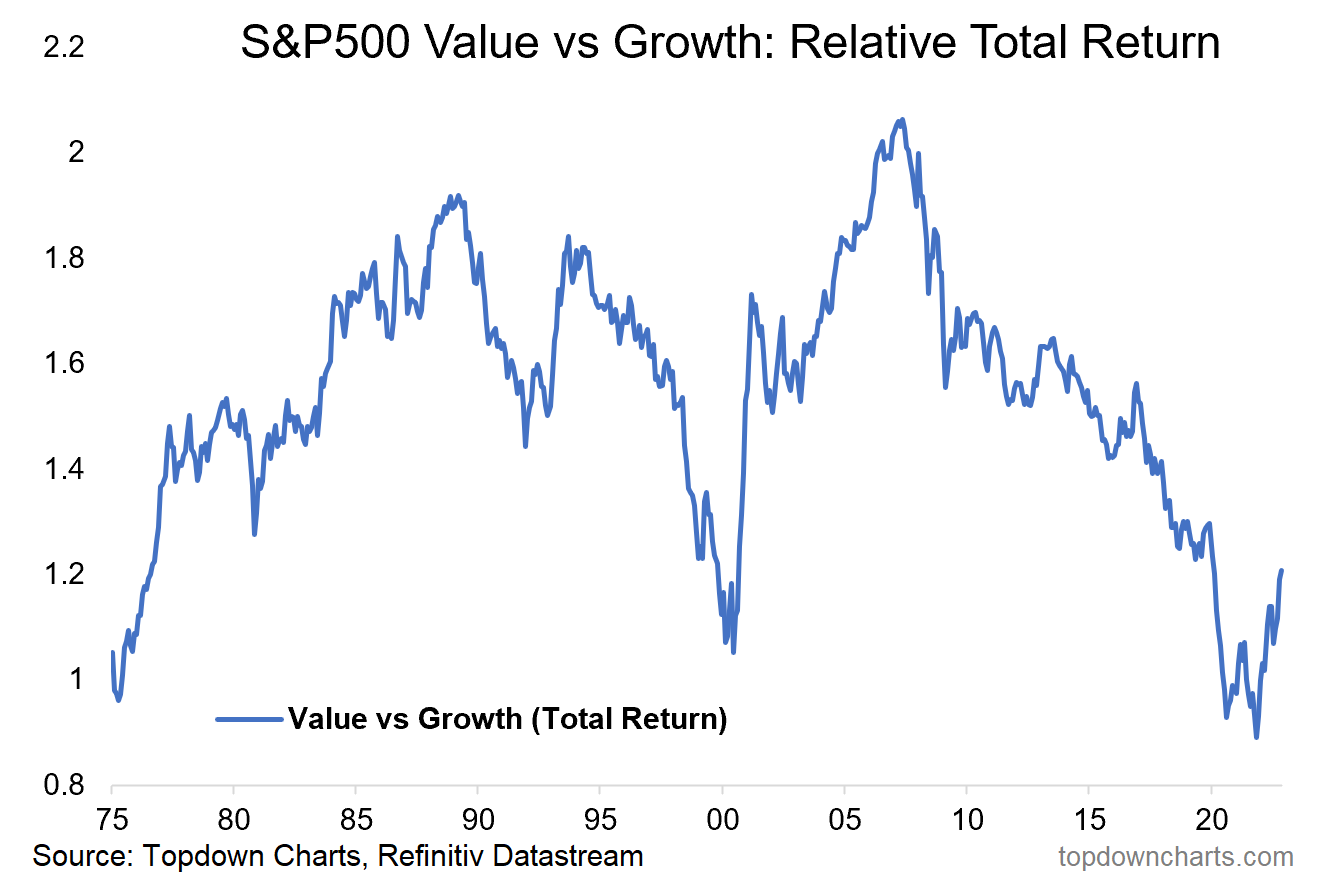
Value vs Growth: markets have a habit of stampeding in one direction, only to turnaround and run just as furiously in the opposite direction. It’s reflective of macro/financial cycles, and social/crowd-psychology cycles.
One of the best illustrations of this is the long-term relative performance chart of value stocks vs growth stocks.
In this chart I have shown the total return view (i.e. inclusive of dividends reinvested) because the price-only view overstates the underperformance of value stocks (given growth stocks historically generated most of their returns from capital growth rather than dividends as such).
https://chartstorm.substack.com/p/weekly-s-and-p500-chartstorm-27-november
Same chart again, everyone watching it, most expect rejection at the 200 and back down again; I do not!
Trendline Tasks: Looks like the market has reclaimed the 4000-level on its second attempt, but now the key task ahead of the S&P500 is to deal with that downtrend line (and the 200-day moving average).
Source: @Callum_Thomas
A busy final week in November:
On the radar
-US house Prices
-PMIs
-Payrolls & Powell
Markets: DXY back to support after failed bounce, 10yr yields trying to breakdown thru 3.7%, gold stalling at resistance, WTI crude broken down to lower support levels, S&P500 brushing up against a key make-or-break point..