


Pgiam/iStock via Getty Images
In an article written last August, I said gold was ready to “break out.” This conclusion was based on two sets of data: the number of shares outstanding in GLD as well as Commitment of Traders data in gold futures. We stated this "break out" would be a long-term advance, not a short-term move.
Since then, the COT data went even more extreme, reinforcing and confirming this view. This is a follow-up article to last August.
The GLD Chart with Graphical Forecast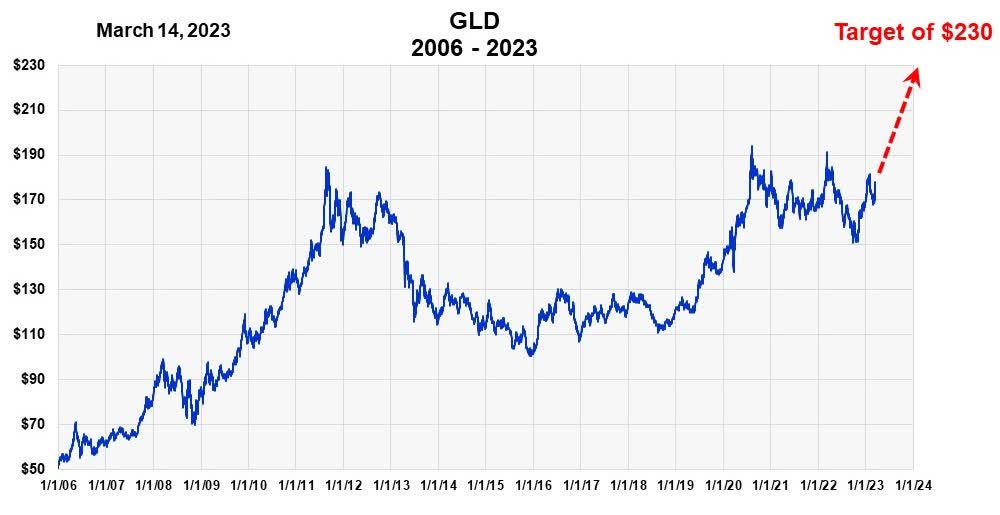
Long term chart of GLD since 2006 (Micheal McDonald)
This GLD chart with the red arrow is very similar to the one in last year’s article, except that GLD was 10% lower and I used a blue arrow. As we said, the "break out" forecast was based primarily on COT data on gold.
People often dismiss futures trading data because it's short term but they miss something important. They miss the fact that, if the intensity of short-term trading carries on long enough, it can be a reliable forecaster of long-term moves.
I'm generally not interested in short-term trading. I attempt to find intermediate to long-term price trends that last from six months to a year. I find these are much easier on the nerves. So, if gold declines over the next couple of weeks I am not concerned. The indicators I look at won't see those moves; they measure the big picture.
Commitment of Traders DataThe first article contained a full explanation of COT data in gold, so I won't repeat it here. However, I'll give a very brief summary.
The Commodity Futures Trading Commission keeps track of the number of futures traders who are long or short a commodity. They classify traders by their basic activity. In the gold market we follow the investment positions of gold "producers" as well as "money managers" who buy and sell gold futures.
History shows that gold producers are relatively right in their position, while the money managers are usually wrong. As groups, both will have long and short positions, but the producers tend to have a higher than normal percent of long positions at price lows, while money managers have their highest short positions.
The first chart shows the percent that producers are long gold. It goes back to 2006. Notice that the highest percents usually occur at lows in GLD, just prior to a major advance. This is what one would want. I've indicated these moments by the black arrows. Notice they don't occur very often. The last high reading occurred just three and a half months ago.
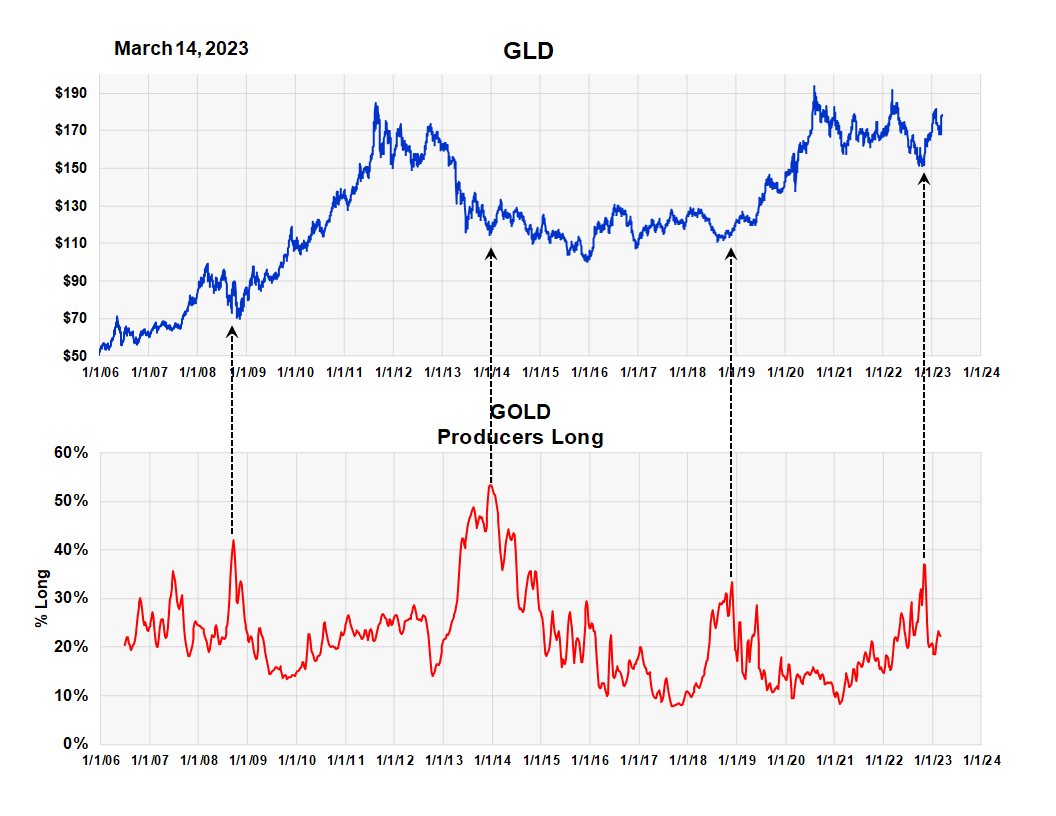
COT Data Producers long position (Michael McDonald)
With money managers we plot the percent they are short gold. This number oscillates from 4% to highs around 65%. Notice that high short positions always seem to occur just prior to a major price advance. If you are an investor this is not what one wants. The last high reading was also in November.
We assume that the high ratio last November will result in a large price move in GLD like it has in the past. This means a price breakout above $190 to a price target of $230.
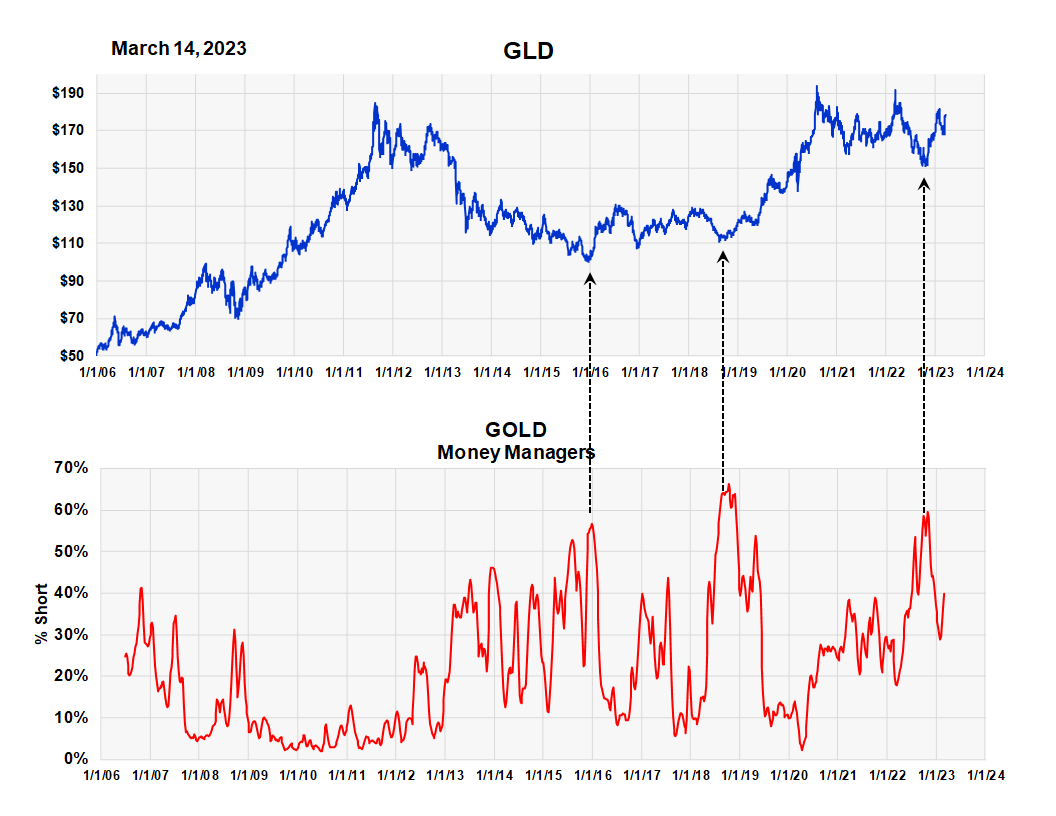
COT data - Short position of money managers (Michael McDonald)
These are Enduring Buy SignalsI want to point out that these extreme ratios occur prior to long term moves, they are not short-term signals. The fact that current ratios have fallen from these extremes numbers is normal and does not change the situation. These extreme readings are what I call enduring, long term signals.
I should say that because of a cyber attack on the future reporting system a few months ago, the system is running three weeks behind. So the charts are missing data from the last three weeks. There is very little chance that the numbers have completely reversed and are now signaling caution. One reason for this confidence is because I use three week averages of the data to help smooth things out and to increase reliability. So, even if trading positions have completely reversed and gone to the opposite extreme, something that has never happened before, I think we are safe with the conclusions from the data we have.
SummarySince our buy signal last August, we continue to believe GLD has started a long-term breakout with a price target of $230 sometime around year-end.
This article was written by


 ].
]. 


