
Backlog of stuff. This is a good article -- GOLDEN CROSS also possible this week:
How much weight should we put on the fact that the S&P 500 index powered above its 200-day moving average (MA) this week? If history is any indication, then this is actually a fairly momentous occasion. Unless it's a repeat of March 2022, in which case we're poised for a push to new lows any minute now.
To be clear, any signal considered bullish or bearish is based on the average reaction back through the history of the financial markets. So, instead of a signal always being 100% bullish or 100% bearish, I tend to think in terms of tendencies. In short, we should ask ourselves, "What tends to happen after this signal has occurred?"
Today, we'll dig into a brief history of the S&P 500 and its 200-day moving average.
The 200-Day as a Market BarometerOne of my mentors used to say, "Nothing good happens below the 200-day moving average." To rephrase, it pays to be patient for a move above the 200-day moving average, because, until then, it's at best a bear market rally.
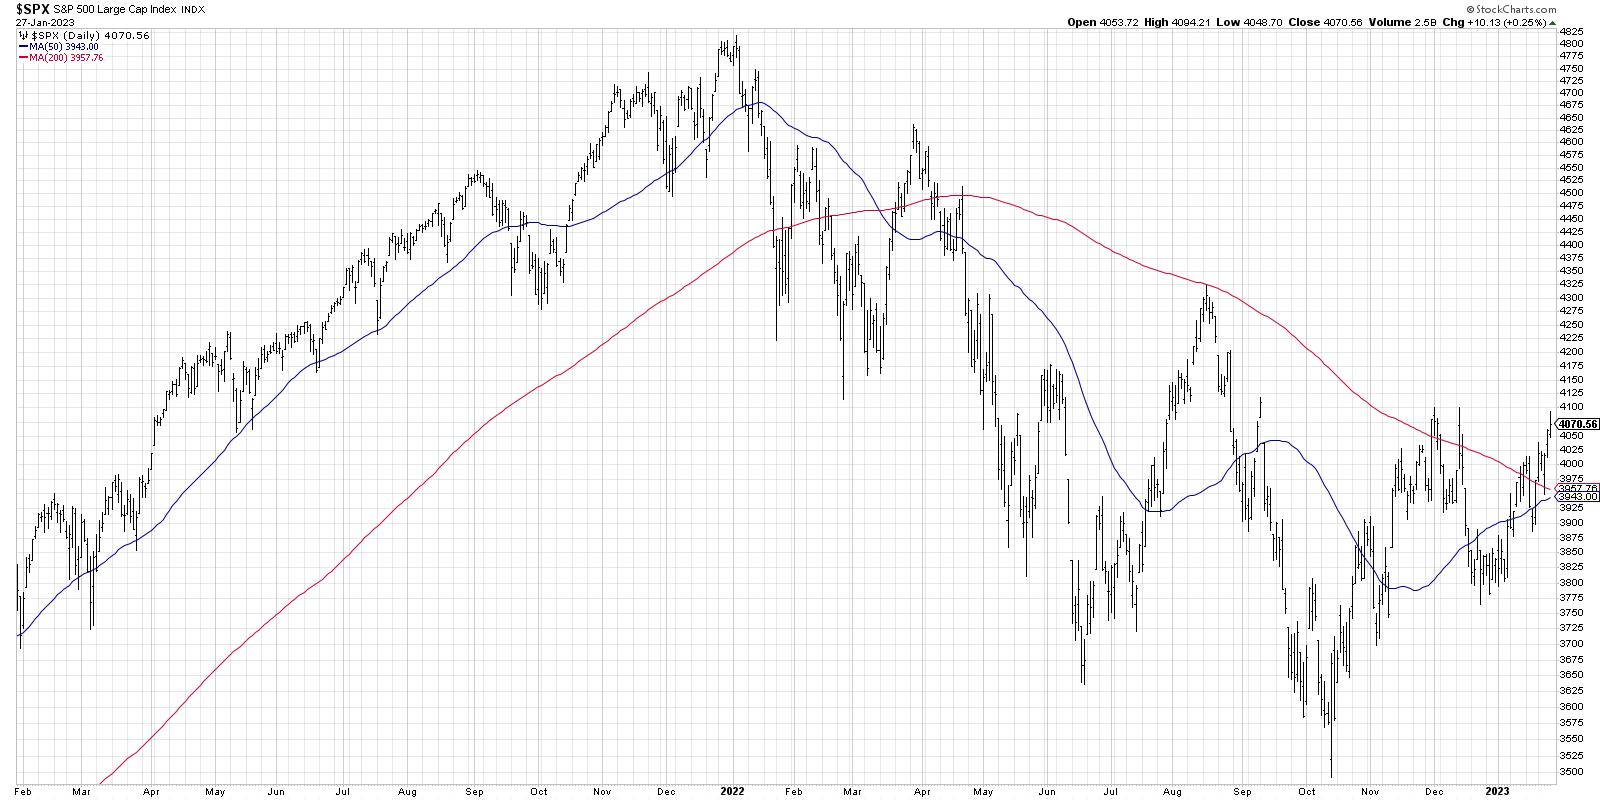
Way back in 2021 (actually not that long ago!), the $SPX stayed well above its 200-day moving average. In fact, it often tested the 50-day moving average, and pretty much every one of those tests ended up being a decent buying opportunity.
In January 2022, when the S&P 500 broke below its 50-day and 200-day moving averages, it suggested that something was different. This is the sort of "change of character" that I hope to identify in my daily and weekly market analysis routines. Attempts to break out above the 200-day in August and November 2022 failed to see any upside follow through. So, when I see the price break above this moving average earlier this month, then the subsequent followthrough with higher swing highs over the last five trading days, I have to consider that a bullish tell.
Going into next week, I'd love to see a confirmed break above the 4100 level, which, I believe, would open the way to a retest of the August 2022 high around 4300. But let's continue our analysis of market history and consider some alternative approaches to the 200-day moving average.
The Moving Average Crossover TechniqueWhile there is often plenty of noise produced when we achieve a "golden cross" or "death cross" on the major averages, I have found them to not be the most effective ways to determine uptrends and downtrends. However, while the timing may not be perfect on these signals, I would admit that the occurrence of a golden cross next week (which seems highly likely if we rally further around the Fed meeting) would confirm even more strength in equities off the October low.
https://stockcharts....0day-b-239.html


