Three Unprecedented, Major Seismic Market Events Due to Hit This Year!
January 29, 2023
By Brad Gudgeon, Editor
The first seismic event is upon us right now! I'm going to be bold here and go out on a limb, but I believe that within the next 6 trading days (Jan 30-Feb 6), the stock market is going to fall (top to bottom) at least 18% in most of the major averages and even more on some indexes. Call me crazy, but that is what I see.
I see Gold down as much as 15-16% possible (this one is the hardest to forecast due to unforeseen reactions to what causes this drop, more on this later), Silver could be down 30% & GDX down as much as 35% in this time frame!
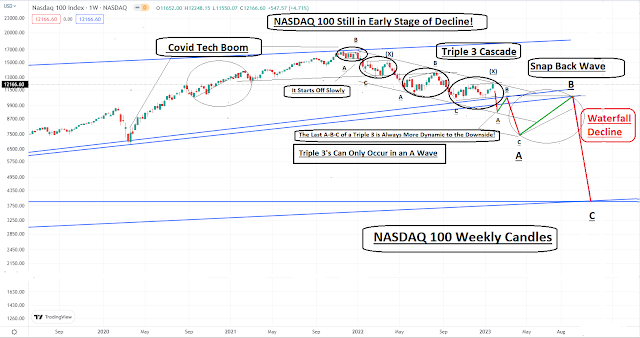
The tech heavy NASDAQ 100 could fall ~23.6% in these next 6 days; the S&P 500 -18%; the Dow Jones Industrials -18.4% and the New York Stock Exchange Index -21.4% based on my read. The Dow Transports could drop as much as 20-21% and the Russell 2000 could be down as much as 20-25%!
Looking at the VIX (Volatility Index) we should see a huge spike as high as in the middle 90's! It is currently near 18. Everything here is documented by charts, but I can't tell you the total methodology at work here, as it would take too much time. I explain a lot on the charts. The concentration of charts here are the VIX and a few stock indexes. The stock market is the leader, so the concentration will be there.
Too many think that when the stock market crashes, precious metals (especially gold), rally, but history has shown that this is not usually the case. Now things could change in the future, so I put gold on a bearish/neutral stance just in case.
The first shock looks to be short in duration, but powerful none the less. Like a quake, it is intensity + time that causes the most damage. This one will be a shocker coming so soon after a top and the quickness of it to boot. I call it the shot across the bow. I believe it will be the start of a move down into April that could easily take out ~40% top to bottom on the S&P 500!
The second seismic event will come after a period of testing and probing the bottom through the month of February and the tech speculators give us another nice and even better bear rally into March, but starting at a lower level. March starts the second quake. It will be almost twice as deep on most indexes (but not the tech indexes this time) and last 23 trading days. Get my drift?
The last seismic event this year comes after a period of months (and once again the public takes charge & takes back the entire March/April decline called the Sucker's Play or B Wave if you will, eventually leading the other fools into the pit). It likely starts as a top in the late summer crashing into the fall. This crash wave one will likely take longer than the March/April decline, but not that much longer. This last wave sequence is what I call the "Killer C", with the B Wave top in the late summer and Wave A finishing in April. Markets always fall in 3 Waves.
This last wave down could easily fall 50+% on most indexes and even more on the NASDAQ 100. The NASDAQ 100 could easily fall 70-80% top (Nov '21) to bottom by the fall of 2023! Crazy as this may sound, don't make the mistake of thinking it impossible or even highly improbable, because history has proven time and time again that excessive credit creation always creates an opposite and equal debt implosion.
Now that I have your attention, let's go look at the evidence.
S&P 500 Daily, "Early Oct 2021 - Feb 6, 2023" Click on Charts to Enlarge

The chart shows all the irregular waves denoted in red ink. Notice the huge clumping of irregular Y Waves since December (there is even another 'y' wave not visible that I will show you on the hourly chart for Friday). This tells me that the public is driving up the SPX due to speculative buying in the tech arena, which is certain to eventually go up in flames. I will show you the NASDAQ 100 chart next & why I think what I do
.
NASDAQ 100 Weekly Late 2019 to Present "The Triple Three Wave Structure"
The New York Stock Exchange Weekly Index Late 2018 to Present

The NYSE Index is way over speculated, losing momentum and up against overhead supply. We have the classic A-B-C "B" Wave Bear Flag with an irregular x-y, x-y (even another x-y on the hourly chart for Friday) that all lead to three dreaded 'z' waves combined together on the downside. These combinations become known as flash crashes of sorts. The NYSE includes all stocks, ETF's, ETN's & ETV's traded on the Exchange. The S&P 500, the Dow Jones Industrials and the Dow Transportation Average are all traded here.
Dow Jones Industrial Average Weekly Late 2019 to Present

The DJIA did not make an irregular Y wave, but instead made a regular B Wave. It has not participated much in the recent buying frenzy, neither has the Transportation Average shown next. This is a BIG warning sign!
The Dow Jones Transportation Weekly Average Late 2019 to Present
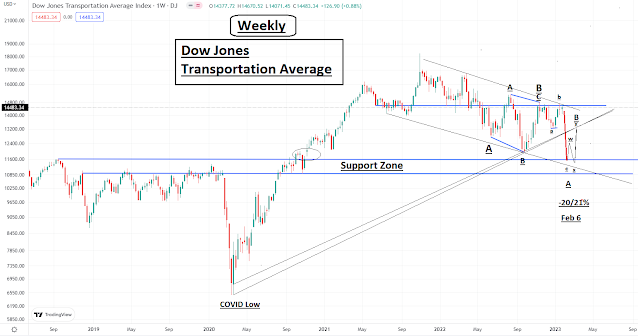
No irregulars here, just plain fact: we are entering into a FED Created Debt Implosion and the economy is slowing down. Dow Theory? Looks like the DJIA and DJTA are in sync. Next, I show you the recent hourly wave count on the S&P 500 with the highly irregular wave counts that have led to sudden flash crashes in the past.
S&P 500 Recent Hourly E-Wave Study

The 8 & 9 TD alternating cycles may come together here and create a minor low on both late Tuesday and again on late Wednesday, making room for a 4 TD high early on Thursday that may be a set up, announcement or event that will be blamed on the increasing Ukraine War escalation, as Thursday to Monday will end up being the final dagger "c" of the bigger Z wave of the sequence, the capitulation wave if you will.
The astros can back this theory as Uranus in Taurus works together with Rahu, the Sun and Venus to become the big disrupter. The Sun (leadership) also trines Mars (war) today (a topping signature) with a square to Rahu and a semi-sq. to Neptune. Next weekend sees the Sun sq. Uranus as Venus ($) squares Mars (war). Mars and Neptune will create their 3rd and final square on March 14 with much social commotion.
I can only see chaos out of the coming week with this kind of technical-wave set up combined with the 54 week and 3 mo/3 wk cycle coming together perfectly. The astros give me the potential why. Uranus in Taurus happens every 84 years and matches the 4th turning cycle of the 4th 21-year generation cycle seen previously as a economic crisis before the American Revolution, American Civil War and WW2.
The recent 16 TD cycles have been running an extra day or 17 trading days, so they include both an 8 and 8+1 cycle. The actual 16 TD low is due on Feb 10 and the next 8/17 TD high is due on the 8th. Notice that the top I'm calling for is an 8+1 and not even close to a 16? The Oct 13 low started unusually off of an 8+1 TD low instead of ~ a 16, so perhaps its poetic justice that we end on the same kind of note. Next a study of the all important VIX weekly chart.

We are at a place that could easily see a huge move up in volatility in the coming days. See the rising bottoms line? This tells me that the volatility wants go up. See how long it's been since we had a good spike up in the VIX? A move to 96 from around 18 is possible in the coming days. In the past, Volatility ETF's like UVXY (or UVIX) have surpassed this index in % move up, going up some 10 even 15 times in violent short covering rallies (The VIX goes up markedly as the market crashes).
Since these ETF's tend to lose money over time, the Wall Street crowd tends to stay short these ETF's as they are long term money makers. When a crisis comes along or big sell-off arrives, the shorts must cover their positions causing them to move up fast in big buy spikes. We are overdue and primed.
I believe the Ukraine War Situation is going to create chaos around the world, especially in March /April and likely to some extent next week. The FED is also a player in this drama. I don't see WW3 starting right now, despite some potential near term fear porn on the loose, only chaos.
Blessings,
Brad Gudgeon
Editor,