

Home Prices Post First Annual Decline Since '12...
Stock Market Isn't as Calm as Seems...
WSJ
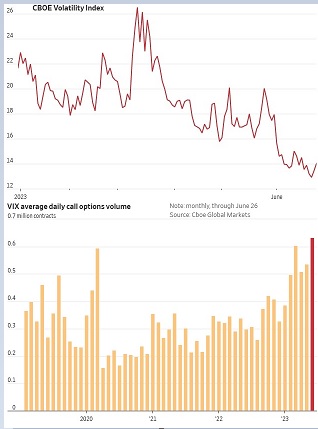
The Cboe Volatility Index, or the VIX, has fallen to around 14, near the lowest levels since February 2020. Known as Wall Street’s fear gauge, the index tracks the price of options often used to hedge against stock-market downturns.
More call options tied to the VIX have changed hands on an average day in June than in any other month on record, according to Cboe Global Markets data.
Traders are scooping up bets on volatility surging at a record clip.
Edited by Rogerdodger, 27 June 2023 - 09:55 AM.


