Jump to content


Photo

No one in this forum, as far as I know, was able to catch the spx top in 2022


  • Please log in to reply
15 replies to this topic

#11 pdx5

pdx5

    I want return OF my money more than return ON my money

  • Traders-Talk User
  • 9,529 posts

Posted 14 July 2023 - 07:48 PM

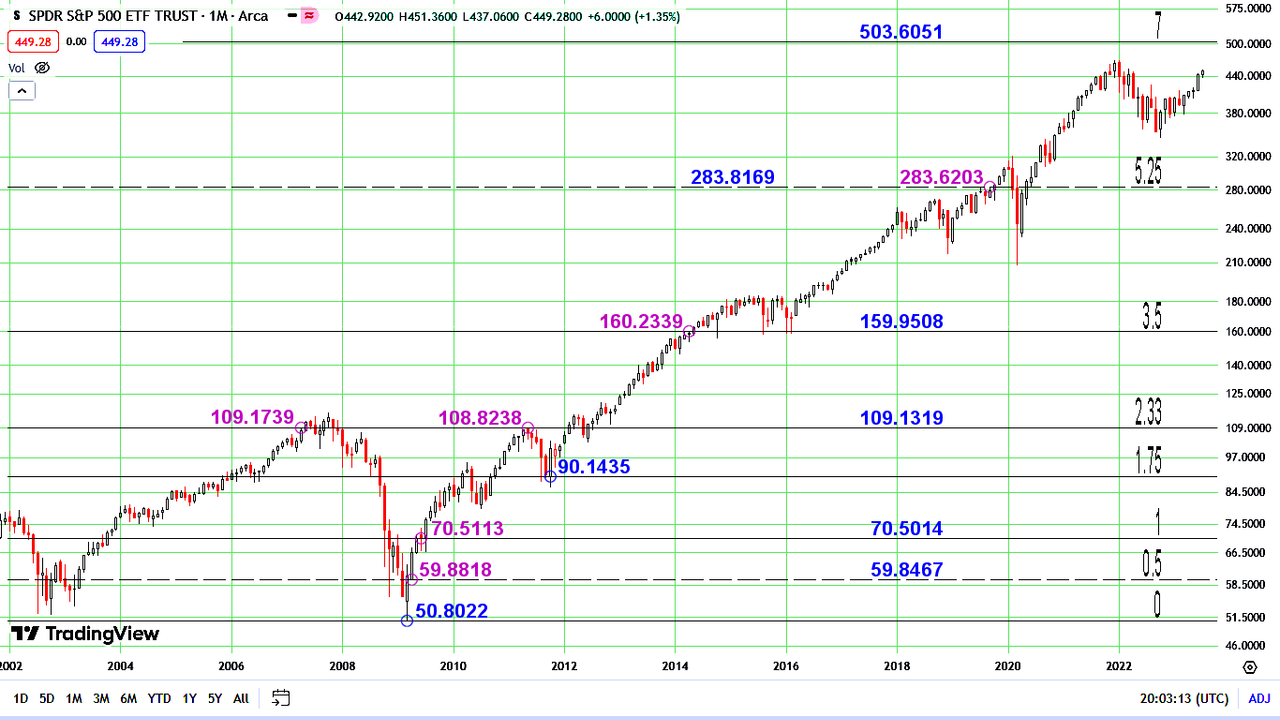
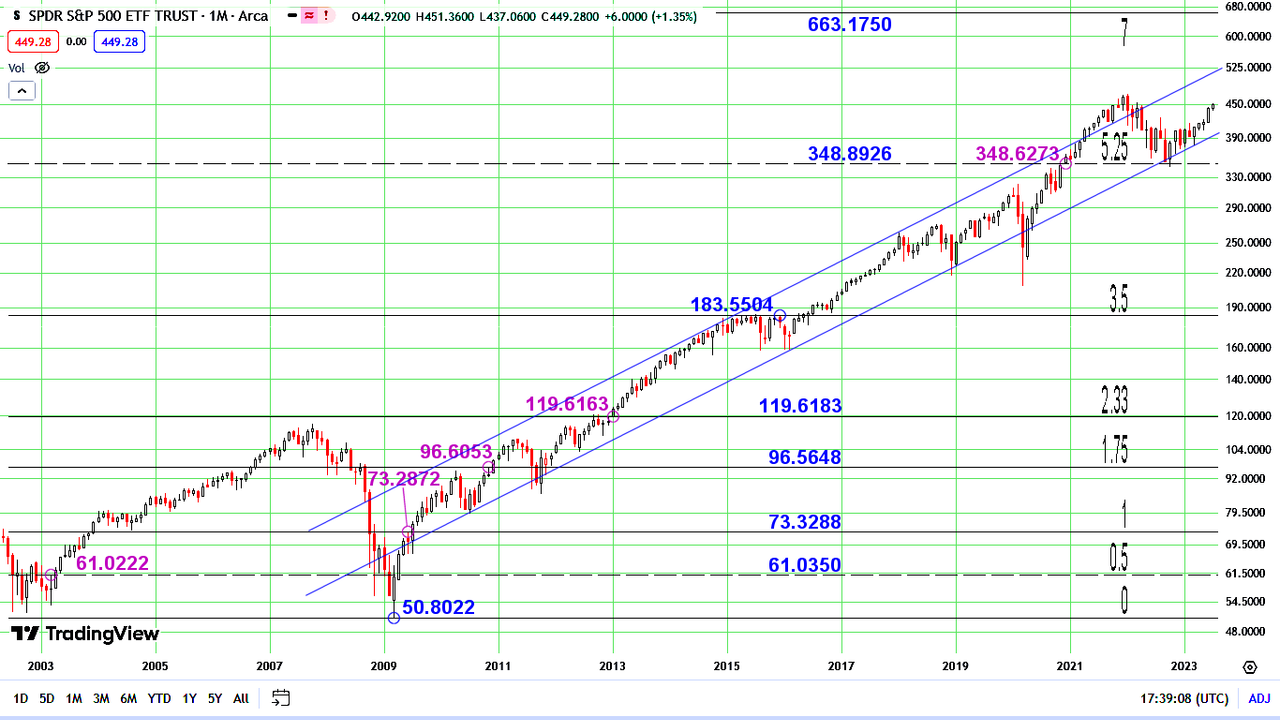
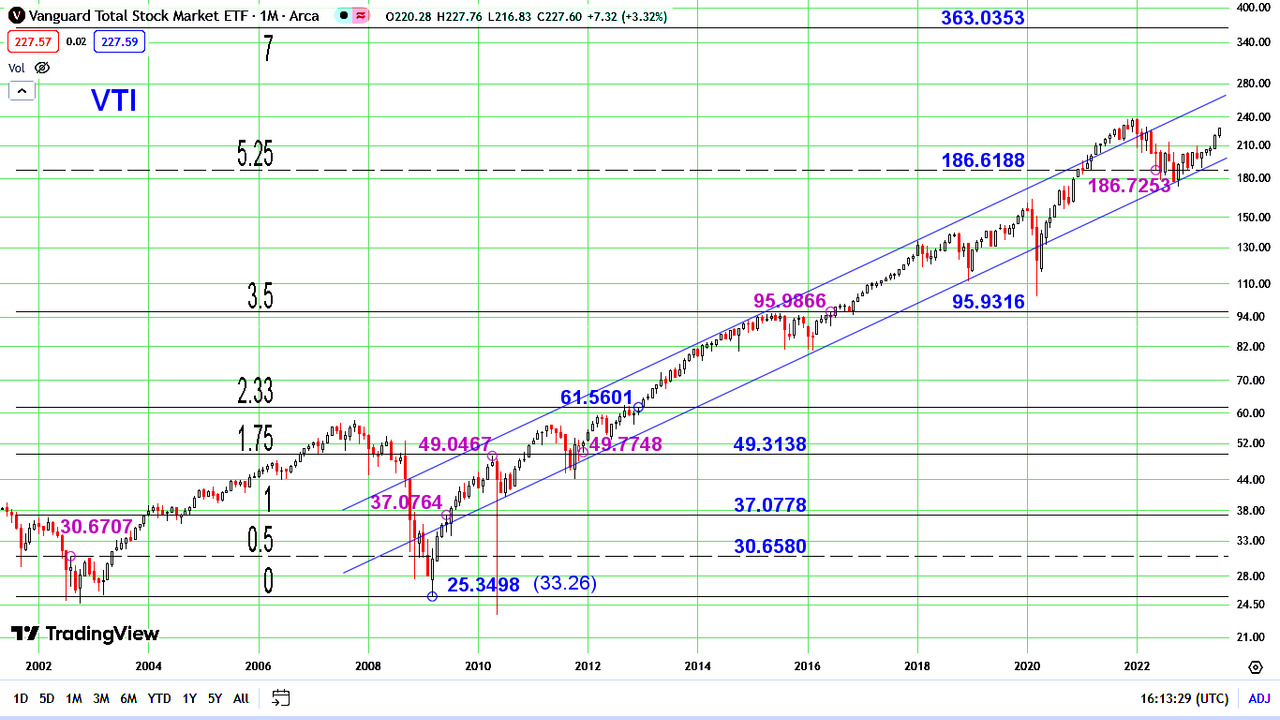
Of course we are in a perpetual long term bull due to perpetual money supply expansion.

But it is never a straight line up. There are frequent 20-40% correction during the long term bull run.

Idea is to benefit by trading. Not sit in a perma-bull seat. And currently the market is bullish. And getting overextended. How high it can go? No one knows!


Edited by pdx5, 14 July 2023 - 07:50 PM.

"Money cannot consistently be made trading every day or every week during the year." ~ Jesse Livermore Trading Rule

#12 andr99

andr99

    Member

  • Traders-Talk User
  • 7,449 posts

Posted 15 July 2023 - 12:20 AM

How high it can go? No one knows!


you said it........that is the reason why catching tops is the best way to get destroyed by the market


people should understand that it's useless having a measure that says the market is overextended if you don't have a measure that tells you for how long it will remain overextended 


Edited by andr99, 15 July 2023 - 12:26 AM.

forever and only a V-E-N-E-T-K-E-N - langbard


#13 steadyquest

steadyquest

    Member

  • Traders-Talk User
  • 775 posts

Posted 16 July 2023 - 11:40 PM

Here's my attempt to identify a 5000ish monthly count to bolster my top call - for what it's worth.


spy-long.png


.


#14 steadyquest

steadyquest

    Member

  • Traders-Talk User
  • 775 posts

Posted 17 July 2023 - 01:04 PM

The above count has a retrace between 2.33 and 1.75, and I wouldn't expect that top to be 'the' top, i.e., one that ushers in significant price reversion.  Maybe this one will do it.


spy-long2.png 


#15 steadyquest

steadyquest

    Member

  • Traders-Talk User
  • 775 posts

Posted 18 July 2023 - 10:07 AM

The count on the above SPY chart would make the S&P almost a perfect tenbagger from the 2009 low of 666. The chart doesn't indicate a low of 66 because it has been adjusted for dividends, so the historical prices are dynamic - they change over time.

#16 steadyquest

steadyquest

    Member

  • Traders-Talk User
  • 775 posts

Posted 19 July 2023 - 01:16 PM

Wonder what's the deal with that flash crash, and why does it show here but not on Stockcharts (and not on SPY or SPX).


vti.png