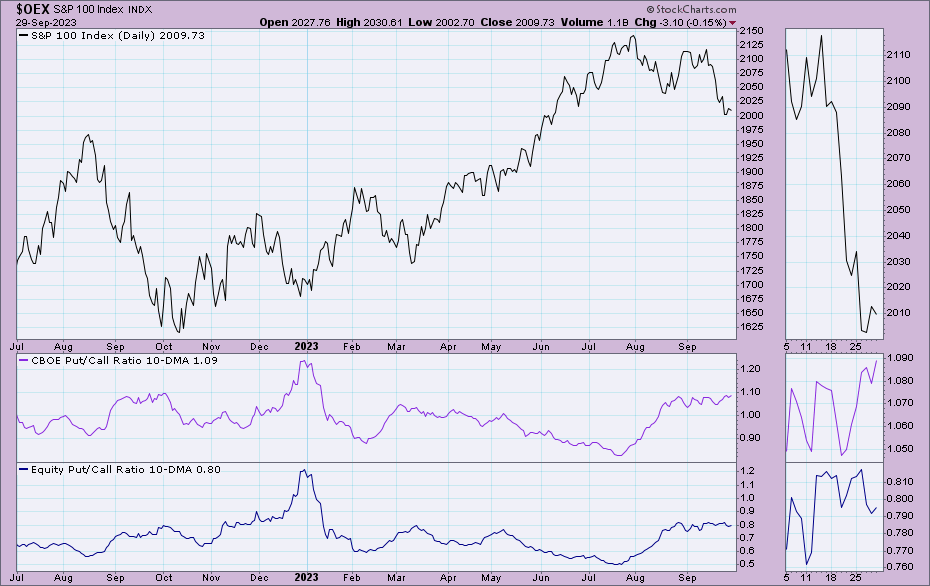
A chart of both the CBOE and Equity 10 day SMA put/call ratios with a price chart of the OEX since StockCharts no longer follows the OEX P/C ratio. The close up charts on the right side focus on the last 21 trading days. One can easily review the chart to see where important price highs and lows are noted in relation to the ratios...the higher the number ratio, the more intense the speculative fear...the lower the number, the more intense the complacency. As many of you already know, we review this information each week, along with implied volatility premiums applied to put options, to get a feel for what traders are actually "betting" on with their money as opposed to what they may be "feeling".
Fib