Jump to content


Photo

Risk Windows and Don't Get too Sentimental


  • Please log in to reply
11 replies to this topic

#11 fib_1618

fib_1618

    Member

  • Traders-Talk User
  • 10,145 posts

Posted 30 September 2023 - 10:50 PM

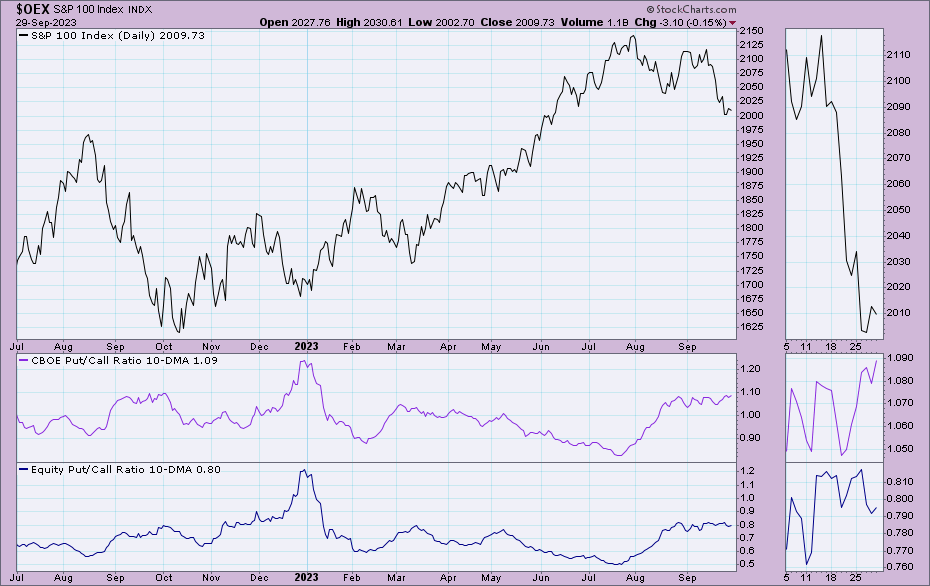
A chart of both the CBOE and Equity 10 day SMA put/call ratios with a price chart of the OEX since StockCharts no longer follows the OEX P/C ratio. The close up charts on the right side focus on the last 21 trading days. One can easily review the chart to see where important price highs and lows are noted in relation to the ratios...the higher the number ratio, the more intense the speculative fear...the lower the number, the more intense the complacency. As many of you already know, we review this information each week, along with implied volatility premiums applied to put options, to get a feel for what traders are actually "betting" on with their money as opposed to what they may be "feeling".


Fib
 

https://tinyurl.com/ytl5ckkg


pcratios092923.png


Better to ignore me than abhor me.

“Wise men don't need advice. Fools won't take it” - Benjamin Franklin


"Beware of false knowledge; it is more dangerous than ignorance" - George Bernard Shaw


Demagogue: A leader who makes use of popular prejudices, false claims and promises in order to gain power.

Technical Watch Subscriptions


#12 trioderob

trioderob

    Member

  • Traders-Talk User
  • 1,295 posts

Posted 01 October 2023 - 12:25 AM

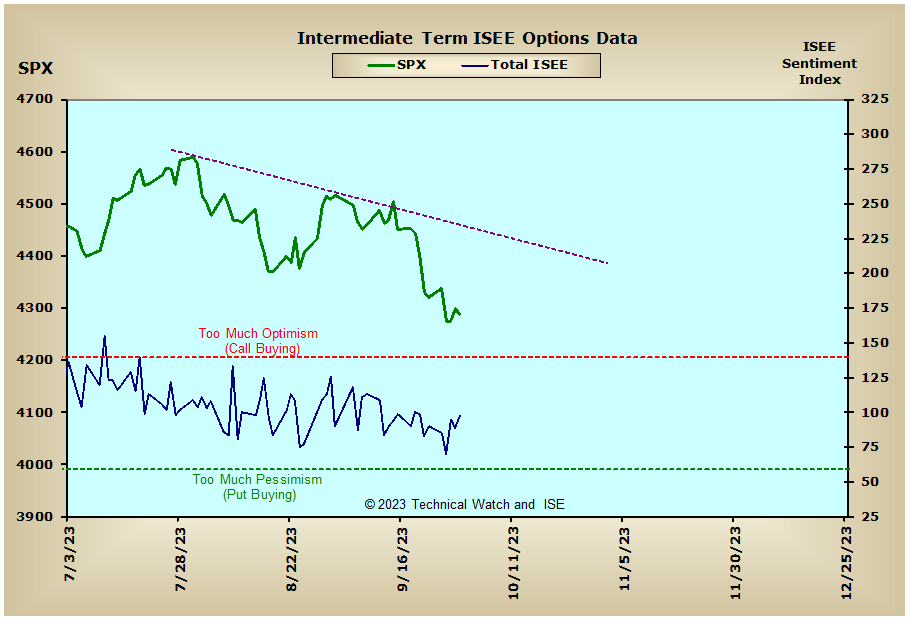
ISEE option data though Friday suggests that we're still looking for a bottom.


Internals continue to suggest further downside to come in October...Friday's rally failure price bar's suggests a weak opening on Monday.


The August 24th forecast remains valid with now a 65% chance of challenging the 4th quarter lows of 2022.


Fib


https://tinyurl.com/ytx28qqx


isee092923.png


I dont agree ..... I believe Monday will be a big up day ...... gap and go .....