Again, the number of bears out there supports this bull. The AAII sentiment is to bearish at 38.4% bulls to 36.6% bears, the odd lotters were net sellers all week, and the weekly CBOE put/call ratio was 0.92. Until the bears give up, it doesn't seem to matter that the number is new highs is falling or that the momentum of the advance decline line has turned down. So for the sake of the ever suffering shorts, get some strange love, stop worrying and learn to love this bull.

Strange Love, Stop Worrying and Love the Bull
Started by
Douglas
, May 20 2007 08:01 AM
11 replies to this topic
#2

Tor
-

- Traders-Talk User
- 7,647 posts
Member
Posted 20 May 2007 - 08:39 AM
This rally is a true dream for the bulls!!! No kidding. It cant actually get any better. Enter, put in a modest stop loss, it doesnt get hit and then goes up and get a quick 10 points. Do the same again unit it stops working.
I am grateful to the bears and also to Ben Bernanke for these gifts.
Observer
The future is 90% present and 10% vision.
The future is 90% present and 10% vision.
#3
Douglas
-
- Traders-Talk User
- 1,843 posts
Member
Posted 20 May 2007 - 09:43 AM
Yep, I call it the B.A.D. trading system - Buy All Dips. It's been working like a charm. God bless the the three B's - Black Hawk Ben, Bears, and Boundless liquidity.
#4
thespookyone
-

- Traders-Talk User
- 6,043 posts
Member
Posted 20 May 2007 - 10:27 AM
I'm not sure why everyone puts so much stock in the AAII poll for gleaning market direction. I do not, as individual investors trade such a SMALL percentage of the market nowadays. Following cash would seem a much better read of sentiment, and the PC ratio lately is hardly screaming that the market is loaded with Bears.
#5
eminimee
-

- TT Member
- 14,307 posts
I don't care who's fur is flying...
Posted 20 May 2007 - 11:46 AM
spooky..same with COT data....I'm noticing certain boards have posts stating that the commercials have got even longer the big contract. After them being short all the way up.....why would it be bullish now that they are long. Useless information as far as I'm concerned..I've never seen any consistency in COT data and how it related to price. Maybe others have...but I can't see it.

#7
arbman
-

- Traders-Talk User
- 19,504 posts
Quant
Posted 20 May 2007 - 12:38 PM
The equity option speculation is off the charts again, the money spent on the calls is almost twice as much as the puts over the past 3 weeks. The average premiums are also rapidly dropping, the index option speculation is even more. Obviously, it's been worse during the last fall and in Jan-Feb before the correction, but not much worse, I think the next spike higher will definitely convince more the market is invincible to the level where an IT correction can begin...
#8
Douglas
-
- Traders-Talk User
- 1,843 posts
Member
Posted 20 May 2007 - 01:18 PM
The following is a plot of the CBOE put/call ratio, a five week moving average, and the DJIA weekly close. Notice that the moving average is near the bottom of its recent range. High values correspond well with times to buy, low ones with times to sell.

#9
Gary Smith
-

- Traders-Talk User
- 887 posts
Member
Posted 20 May 2007 - 01:21 PM
spooky..same with COT data....I'm noticing certain boards have posts stating that the commercials have got even longer the big contract. After them being short all the way up.....why would it be bullish now that they are long. Useless information as far as I'm concerned..I've never seen any consistency in COT data and how it related to price. Maybe others have...but I can't see it.
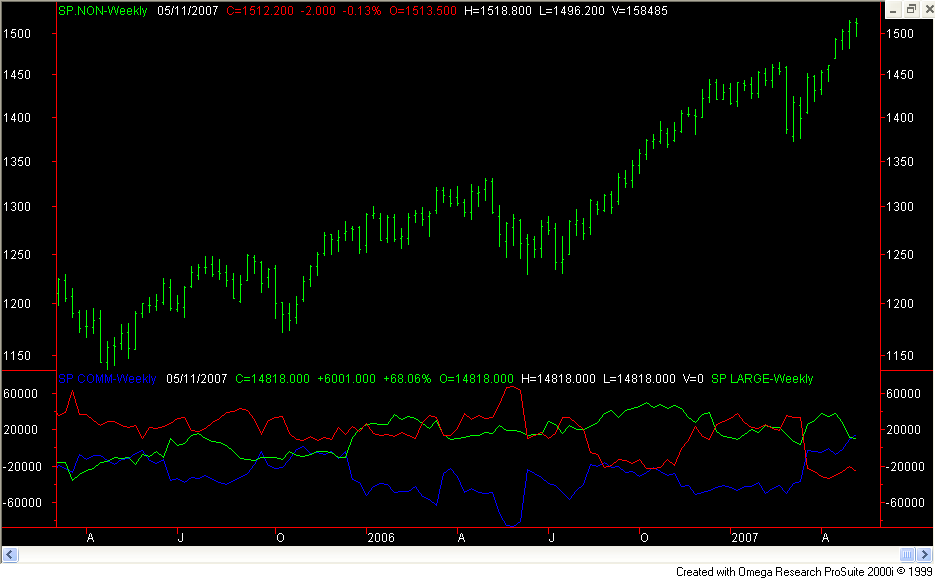
More of this sentiment is an art not a science perhaps? I look primarily at the large S&P COT data and can't think of a more spot-on indicator since the spring of 06. At the May 06 price peak, commercials were at bear market net short postion as well as at the 2/27/07 price peak. As those breaks unfolded the commercials rapidly reduced their shorts and/or went net long. The configurations between the commercials and the small specs the past 8 weeks have been as good, if not better, than at anytime this decade and remains at surprising bullish levels. It even looks like the large specs are about to revert to net short. I will agree with you that the COT can be inconsistent. It was a super indicator in the mid to late 80s/early to mid 90s but pretty worthless beginning about 96 until September of 2000 where it was then pretty much spot-on throughout the ensuing bear market.
Edited by Gary Smith, 20 May 2007 - 01:22 PM.
#10
CLK
-

- Traders-Talk User
- 10,787 posts
Member
Posted 20 May 2007 - 01:22 PM
The equity option speculation is off the charts again, the money spent on the calls is almost twice as much as the puts over the past 3 weeks. The average premiums are also rapidly dropping, the index option speculation is even more. Obviously, it's been worse during the last fall and in Jan-Feb before the correction, but not much worse, I think the next spike higher will definitely convince more the market is invincible to the level where an IT correction can begin...
Kisa,
The calls have been way undervalued vs. puts for the last three weeks.
I've seen as much as 50% higher premium in the puts, somebody been
wanting them pretty bad. I thought about trying a decent put position for
a dip or two but the premiums were inflated.


