Jump to content


Photo

AAII


  • Please log in to reply
7 replies to this topic

#1 OEXCHAOS

OEXCHAOS

    Mark S. Young

  • Admin
  • 22,027 posts

Posted 02 June 2007 - 11:38 AM

Someone asked about AAII. Here's a chart from DecisionPoint.com (I highly recommend taking the service, there's deep historical indicator stuff available). AAIISPX6_01_07.png AAII6_01_07.png My read is that this is supportive of a continuation of the Bull market. It's Bullish, but as a short-term indicator, it's not so good. With the right type of set up from the other sentiment, we can go down with these types of readings. It's just not likely that we go down for too long. I'll be writing more about this in the letter and probably in my much-neglected Blog this weekend.

Mark S Young
Wall Street Sentiment
Get a free trial here:
http://wallstreetsen...t.com/trial.htm
You can now follow me on twitter


#2 Rogerdodger

Rogerdodger

    Member

  • TT Member*
  • 26,878 posts

Posted 02 June 2007 - 12:14 PM

From spielchekr's post below:

I think we need to call in an expert here (ahem, Mark?). The author implies that rather than launching us higher, this discrepancy is rather supporting the dip buying, if I'm rephrasing his interpretation correctly.


Thanks Mark!

It seems to me:
Different sentiment sources have different sample sources and sizes, sampled at different time intervals.
Thus, one reading may be reflecting the most current news or market condition at the time it was taken, whereas another, taken a day later and from another sample source may reflect something else.
Each can add a thread to the overall sentiment tapestry.

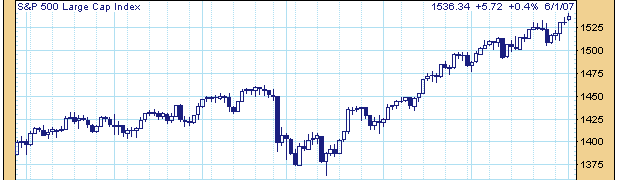
As the markets make new highs, you would expect sentiment to become more bullish.
That in itself might not be a "sell" signal since it is really a confirming signal.

But just the opposite has happened during the past year!
As the markets have rallied, sentiment has remained muted.
That to me, this has been a very bullish divergence.
Therefore, while short term jumps in bullishness usually pull back price, they may be offering opportunities to buy the dip rather than sell. (Depending of course on one's trading style.)

This might be true, at least until we see the longerterm measures at higher levels.

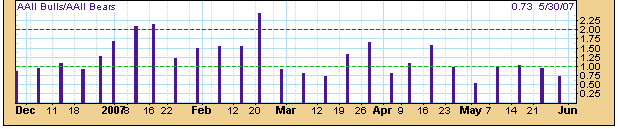
I've mentioned this one before. Notice that sentiment has only touched 70 one time in over a year.
It even got below 30 to begin a 200+ point S&P rally!
VERY UNUSUAL! It did nearly the same in 2002 but while the market was at multi year lows.
Now we have the same readings near all time highs?
Posted Image

Note that after weeks of neutral readings, sentimentrader is showing more bullishness.
Note the extreme bullishness going into Thursday. It gave us a doji day.
For the reasons mentioned above, I suspected it would not be a big selloff but rather:

Wednesday's Post:
I have only a guess:
Labored gains, pause, hesitation, nominal new highs

(Also the jump in pessimism going into Friday before Memorial day was the beginning of a 30 point S&P rally.)
Posted Image

Edited by Rogerdodger, 02 June 2007 - 02:14 PM.


#3 Tor

Tor

    Member

  • Traders-Talk User
  • 7,647 posts

Posted 02 June 2007 - 12:59 PM

Bears are totally delluded IMO. Simple as that.
Observer

The future is 90% present and 10% vision.

#4 bullishnot

bullishnot

    Member

  • Traders-Talk User
  • 66 posts

Posted 02 June 2007 - 01:16 PM

Someone asked about AAII. Here's a chart from DecisionPoint.com (I highly recommend taking the service, there's deep historical indicator stuff available).

AAIISPX6_01_07.png
AAII6_01_07.png

My read is that this is supportive of a continuation of the Bull market. It's Bullish, but as a short-term indicator, it's not so good. With the right type of set up from the other sentiment, we can go down with these types of readings. It's just not likely that we go down for too long.


I'll be writing more about this in the letter and probably in my much-neglected Blog this weekend.


However, bears in bsx, dndn, amd, and many others ain't exactly hurting, more like reaping huge gains from a while back.. keep pumping, oh yeah..

#5 qqqqtrdr

qqqqtrdr

    Member

  • Traders-Talk User
  • 3,221 posts

Posted 02 June 2007 - 01:52 PM

I invest in Technology. I must admit that technology companies are not doing well. Here in Austin we have AMD looking at layoffs, Dell laying off 10% of there workforce, and Freescale laying off 5% this week alone. This is after they have been trimming staff for the last couple of years. Yes, high tech companies are getting more lean to keep Wall Street happy, but their revenues are going down. This is why so many institutional investors continue to stay bearish, because fundamentals continue to deteriorate. Barry

#6 Rogerdodger

Rogerdodger

    Member

  • TT Member*
  • 26,878 posts

Posted 02 June 2007 - 01:59 PM

Aren't there always "reasons" to be bearish? Just as at tops there are reasons to be bullish.

#7 OEXCHAOS

OEXCHAOS

    Mark S. Young

  • Admin
  • 22,027 posts

Posted 02 June 2007 - 02:47 PM

Someone asked about AAII. Here's a chart from DecisionPoint.com (I highly recommend taking the service, there's deep historical indicator stuff available).

AAIISPX6_01_07.png
AAII6_01_07.png

My read is that this is supportive of a continuation of the Bull market. It's Bullish, but as a short-term indicator, it's not so good. With the right type of set up from the other sentiment, we can go down with these types of readings. It's just not likely that we go down for too long.

I'll be writing more about this in the letter and probably in my much-neglected Blog this weekend.


However, bears in bsx, dndn, amd, and many others ain't exactly hurting, more like reaping huge gains from a while back.. keep pumping, oh yeah..


We've consistently had one or more shorts in ChartSmarts over the past several weeks. It's not been a painful experience, either. Now, with the RUT coming on, we might want to be less Bearish even on individidual issues, but we really need to see how the secondaries fare after the next decline.

BTW, it's coming. Just probably not Monday (subject to revision).

Mark

Mark S Young
Wall Street Sentiment
Get a free trial here:
http://wallstreetsen...t.com/trial.htm
You can now follow me on twitter


#8 qqqqtrdr

qqqqtrdr

    Member

  • Traders-Talk User
  • 3,221 posts

Posted 02 June 2007 - 04:45 PM

Someone asked about AAII. Here's a chart from DecisionPoint.com (I highly recommend taking the service, there's deep historical indicator stuff available).

AAIISPX6_01_07.png
AAII6_01_07.png

My read is that this is supportive of a continuation of the Bull market. It's Bullish, but as a short-term indicator, it's not so good. With the right type of set up from the other sentiment, we can go down with these types of readings. It's just not likely that we go down for too long.

I'll be writing more about this in the letter and probably in my much-neglected Blog this weekend.


However, bears in bsx, dndn, amd, and many others ain't exactly hurting, more like reaping huge gains from a while back.. keep pumping, oh yeah..


We've consistently had one or more shorts in ChartSmarts over the past several weeks. It's not been a painful experience, either. Now, with the RUT coming on, we might want to be less Bearish even on individidual issues, but we really need to see how the secondaries fare after the next decline.

BTW, it's coming. Just probably not Monday (subject to revision).

Mark


I've been monitoring the Put/Call Ratios... That is OEX, CBOE, and Equity. Equity Put/Call is relatively low and OEX is relatively high, so at the moment it looks mildly bearish. Also QQQQ Max Pain is at 46, so it appears we should be at least at a point where the indicies should not rise over the next couple of weeks.

barry