xD,
I am wondering what is continuing to inspire your bearish outlook. I acknowledge the numbers that you are mentioning, but they are fresh. The II ratio went bad just last week and the CPCE/CPCI numbers went belly up only Friday. So while i can understand a negative outlook on let's say this week, your IT bearish outlook is puzzling. There has to be something more than just this last week's development....right?
Also, why do so many people insist that the COT data is bullish - a stark contradiction to what you have been suggesting.
-rkd
p.s. did you make your blog private?
Aside from option and sentiment polls which are supportive for a decline in my opinion, most of the intermediate term internals are in sell.
Both Nasdaq and NYSE new highs-lows diff. been declining since early April. Number of the stocks above 50 and 200 dma in Nasdaq and NYSE topped out before Feb 27 crash, all indices made significant higher highs ever since , these measures are still going down. Bullish percentages that measures number of the stocks breaking out are going down on both indices.
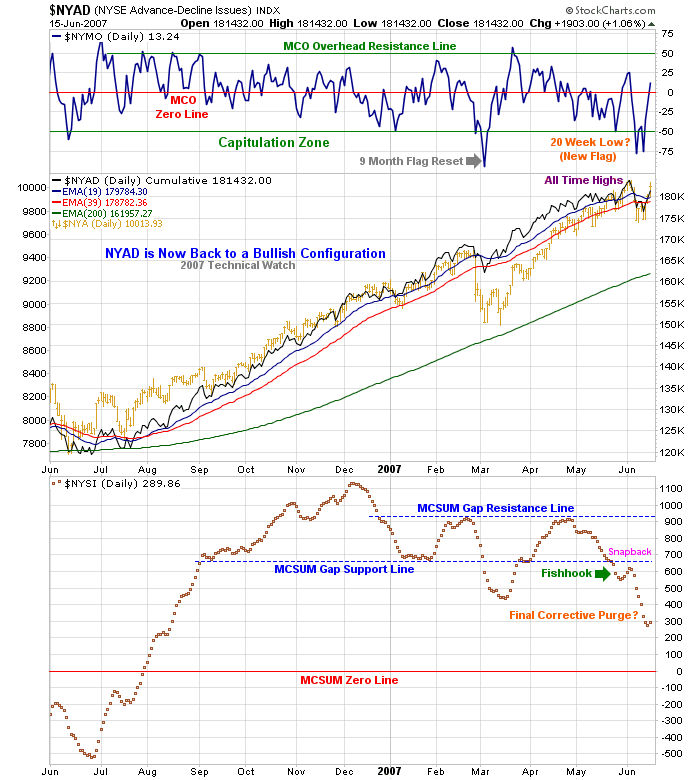
Not to mention, McSums are in downtrend for sometime now. NYSE is about to make new all time highs, AD line is not even close.
While those divergences may last longer than most can stay liquid, one of my favorite indicators, 10 DMA of equity PC hit the spot. IF you have it, just draw a line through July 05, Jan 06, December 06 tops, that is the trend that was hit in early June. After a brief topping action, S&P cratered 50 points 2 weeks ago. But that was just a start. Most of the corrections/sell offs this indicator nailed in the past lasted minimum 3 months.
Dear God, my bond / stock system is giving a sell signal in biblical proportions as of Friday's close.
COT data is not getting bullish, is not very bearish either but it is getting bearish. Some people analyse COT data as a whole, including eminis and other indices which may be used for hedging. I think SP big contract where commercials and large traders operate.
No I did not make my blog private
Edited by xD&Cox, 17 June 2007 - 02:07 PM.