

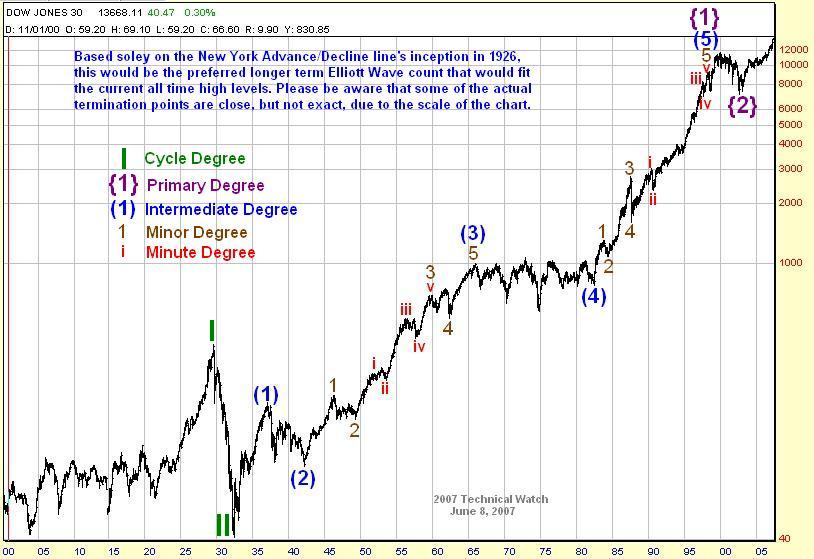
Have you worked with Elliott Wave analysis for any length of time?
By any means, you might be gifted about this, but I spent hours, and I mean I am an artist as much as I am an engineer and I did try! All I can say is, I can give you a completely random chart with only 3 or 4 cycles superposed and you will be able to identify a ton of EWP patterns --and worst of all you will convince yourself about a certain outcome or expectation at the end!!!
IMHO, most of the patterns are mere coincidence and they simply do not exist. I put together serious pattern searching algorithms using the discrete wavelet decompositions and the accuracy of any specific pattern or group of conditional patterns is much worse than the cycles, or the results are not any better than a simple momentum system, so why bother to decipher the patterns? Most of the general rules about the deep retracements, flats etc are naturally explained by the cycles and in a sense more scienfitically anyway...
I can not show to my partners any EWP chart, but the momentum, rate of change, correlation, cycles...


 ....and besides 4.s dont bring out end of the world prognostications like 2002 did.....waves 2.s do that.....


