So I'm doing a study on parabolics. We know it occurs quite frequently, and we know trying to predict its behavior is very challenging (at least to us mere mortals, perhaps some hedge funds have an edge).
To start, lets try and discern what a parabolic is in the first place:
1. Its a price move that increases seemingly in parabolic fashion, ie gaining much faster over time, and to add to it, not much volatility (ie no ups and downs, just ups).
2. There are different flavors of parabolics. Some have parabolic run ups then shoot down very quickly (needle formation), some just stop going up parabolically and start to consolidate or move up diagonally.
3. There are different time frames to parabolics. Some exhibit this behavior over days, some over weeks, some over years. Bar charts may show parabolic behavior on weekly or monthly bars, but not on daily or hourly bars, for example.
So now that its defined a bit, lets try and rationalize why a parabolic occurs:
1. Mechanically, its a sudden increase in demand vs supply, whether that be caused by short covering, genuine desire to own stocks, or whatever.
2. Lack of selling by core holders of the float adds to shrinking of supply. And many momentum players can recognize parabolics and the shape itself generates excitement and creates demand.
3. Perhaps some manipulation by operators who want to either increase their holding or prepare it for a short position.
Those are reasons, but I want to concentrate on the most dangerous type of parabolic, the needle formation. Why these are created and why these have such sharp drop offs...
1. I assume that most rapid drop offs are because too many nervous (or weak) money is in the stock. It could be people who just put their money into the parabolic because some other stock they owned was getting trashed and they decide this one was never going down.. or because its retail investors suckered into it at high valuation.
2. It could be that the last parabolic rise was a short squeeze after which the demand is completely gone, and everyone who wanted to own the stock has done so.
3. It could be operators trying to balance their books when the rise has gone on so much that their books get completely unbalanced.
But the question remains.. time wise, price wise, how do you know where the EXACT TOP is on a given stock? Can history provide us a clue? If we average the parabolic run ups of many stocks, does that give us a clue into the % rise and time to peak?
I'll try to post some charts on this later.

When do parabolics terminate?
Started by
dcengr
, Nov 03 2007 03:04 PM
23 replies to this topic
#1

dcengr
-
- Traders-Talk User
- 13,391 posts
Member
Posted 03 November 2007 - 03:04 PM
Qui custodiet ipsos custodes?
#2
dcengr
-
- Traders-Talk User
- 13,391 posts
Member
Posted 03 November 2007 - 03:18 PM
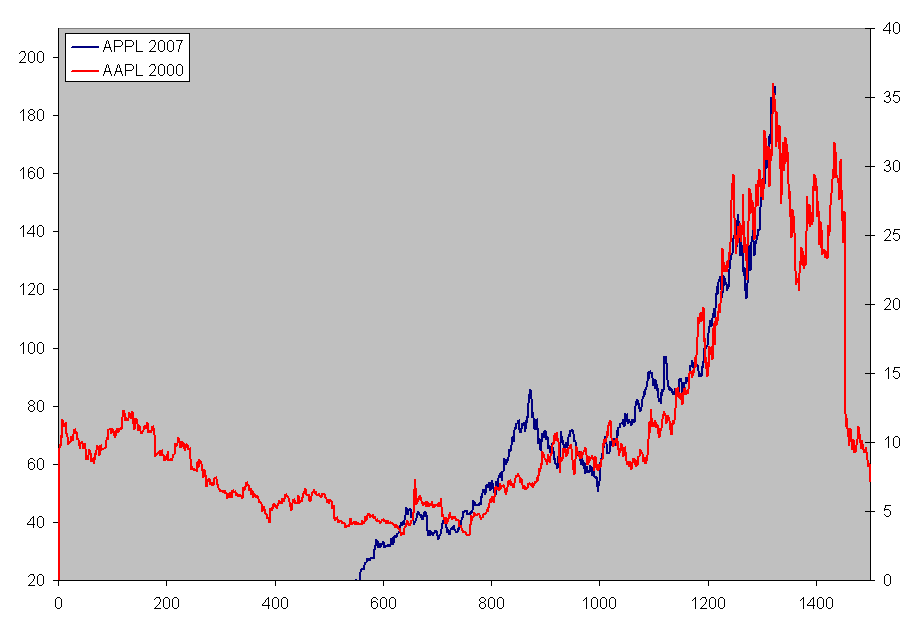
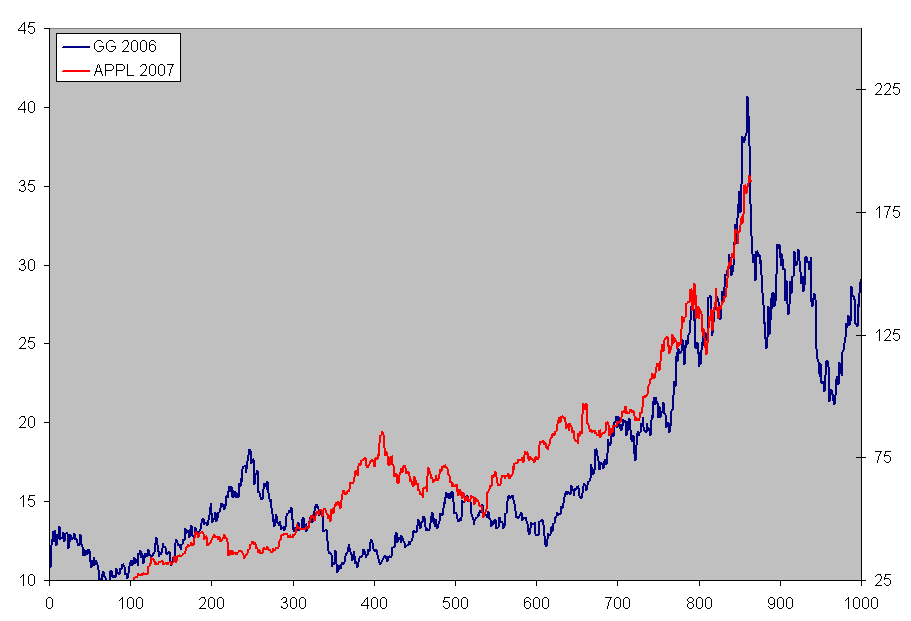
Here are two charts, one is AAPL 2000 vs AAPL 2007, and one is AAPL 2007 vs GG 2006..
What are the similarities and differences? How can we tell where the end is?
What are the similarities and differences? How can we tell where the end is?
Qui custodiet ipsos custodes?
#3
Trend-Signals
-

- Traders-Talk User
- 1,136 posts
Member
Posted 03 November 2007 - 03:26 PM
I like your writing; however, one point....
We are in global economy. I think that we have better PE based on reasonable forward PE with reasonable expectation than that of 2000 and , also, a few selective stocks in parabolic mode.
We are entering to huge China economy, e.g. RIMM.
Do you think that many Chinese/India kids will own iPod and iPhone?
#4
dcengr
-
- Traders-Talk User
- 13,391 posts
Member
Posted 03 November 2007 - 03:31 PM
Eh this post is not about whether the bull will continue or not. Its just a way to see if someone has insights into being able to tell when a parabolic can end.
I'm not saying AAPL will end anytime soon. In fact, comparing it to GG chart shows it can head much higher. The question is, is there some characteristic that all parabolics share that can identify when they terminate? Thats worth a lot of money, ofcourse.
For instance, gold is doing fine, but GG took a massive dump. How do we know when GG would collapse? Obviously it recovered, but still the price decline is massive.
This convo is all about trying to trade off charts, not a discussion on bull/bear.
Qui custodiet ipsos custodes?
#5
Trend-Signals
-
- Traders-Talk User
- 1,136 posts
Member
Posted 03 November 2007 - 03:47 PM
Well, you posted a chart comparing 2000 and 2007 AAPL chart... so, market top usually terminates parabolic moves, is it not?
#6
dcengr
-
- Traders-Talk User
- 13,391 posts
Member
Posted 03 November 2007 - 03:51 PM
Well, you posted a chart comparing 2000 and 2007 AAPL chart... so, market top usually terminates parabolic moves, is it not?
Only if that stock was the leader of the pack.. I can show you some other NDX parabolics that died a while back and it did nothing to NDX price..
If the index itself is going parabolic, then perhaps.. but NDX only slightly looks parabolic right now, not even close to 2000 era.
The parabolic price pattern in AAPL is real, however. It could be that when AAPL dies, NDX goes with it. But its not a given. And theres no telling when AAPL will stop, which is why I opened this discussion.
It could also be that parabolics are all naturally different and they do not share a characteristic that one can use to tell when each of them will die.
Qui custodiet ipsos custodes?
#7
Trend-Signals
-
- Traders-Talk User
- 1,136 posts
Member
Posted 03 November 2007 - 03:55 PM
Yep, that is the reason that I mentioned AAPL fundamentals.
So, all bears wishing for AAPL to die, but it seems that AAPL is knocking China door like RIMM.
#8
dcengr
-
- Traders-Talk User
- 13,391 posts
Member
Posted 03 November 2007 - 04:13 PM
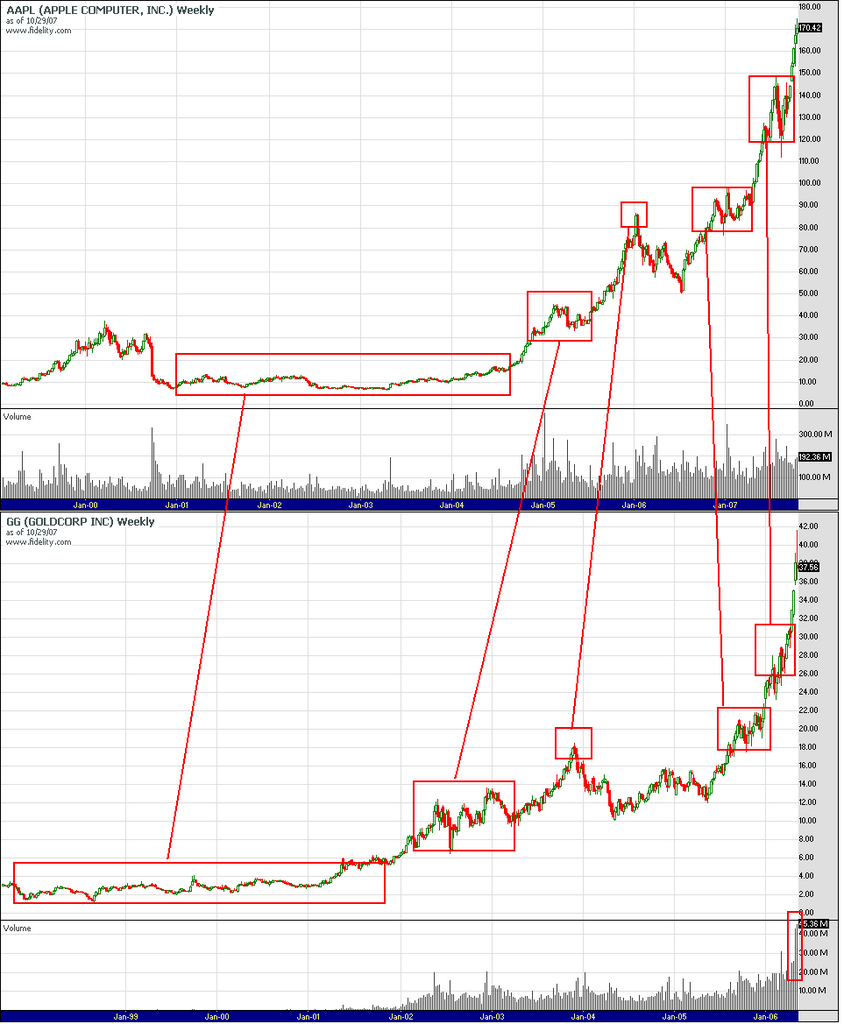
This is an attempt at characterizing the GG parabolic curve to AAPL.. going from left to right
1. Note the long base formed before the initial take off.
2. Then it forms a peak and consolidates
3. Then its first primary peak and decline
4. It rises near this primary peak and decline, and begins consolidating
5. Then after consolidation, it begins moving higher
6. Then after some rise, it consolidates again
7. Finally it gaps and runs and runs until it exhausts itself and reverses. Note the increasing volume near the peak
So far the characteristics are the same, but if this was the last run, I do not know where the final run will end. Now compare this chart with a chart of FXI and you will note similarities... I need to find me some more parabolic stocks and do some comparisons.
Qui custodiet ipsos custodes?
#9
Trend-Signals
-
- Traders-Talk User
- 1,136 posts
Member
Posted 03 November 2007 - 04:20 PM
AAPL 300 based on my technical analysis and also fundamental with good marketing and selling.
Heard someone targeted 600 I would say that would be the case when all china and india kids own iPod and iPhone
Date: 10/22/2007 7:45:16 PM
Post #
AAPL LT 300 R based on the fib and TL as shown on the chart that it has broken out of 20yr TL during Sep05. Then it retested the breakout in Jul06. It also has broken out of fib R in May 2007, not it is heading near to 300.
Fundamentally, it looks to be supporting the price actions as it is continuing to grow. The current PE shows 33.

Heard someone targeted 600
I would say that would be the case when all china and india kids own iPod and iPhoneDate: 10/22/2007 7:45:16 PM
Post #
AAPL LT 300 R based on the fib and TL as shown on the chart that it has broken out of 20yr TL during Sep05. Then it retested the breakout in Jul06. It also has broken out of fib R in May 2007, not it is heading near to 300.
Fundamentally, it looks to be supporting the price actions as it is continuing to grow. The current PE shows 33.
#10
fib_1618
-

- Traders-Talk User
- 10,145 posts
Member
Posted 03 November 2007 - 04:22 PM
Newton's Second Law of Motion states:It could also be that parabolics are all naturally different and they do not share a characteristic that one can use to tell when each of them will die.
"The rate of change of momentum of an object (or a price pattern's price) is directly proportional to the resultant force (or money flow) acting on it."
Don't forget to include inverted parabola patterns as well...it's not just a one way street.I need to find me some more parabolic stocks and do some comparisons.
Fib
Better to ignore me than abhor me.
“Wise men don't need advice. Fools won't take it” - Benjamin Franklin
"Beware of false knowledge; it is more dangerous than ignorance" - George Bernard Shaw
Demagogue: A leader who makes use of popular prejudices, false claims and promises in order to gain power.
Technical Watch Subscriptions


