Jump to content


Photo

When do parabolics terminate?


  • Please log in to reply
23 replies to this topic

#11 dcengr

dcengr

    Member

  • Traders-Talk User
  • 13,391 posts

Posted 03 November 2007 - 04:24 PM

This is a close up of GG vs AAPL.. note that before THE top, volume surged dramatically..

Posted Image

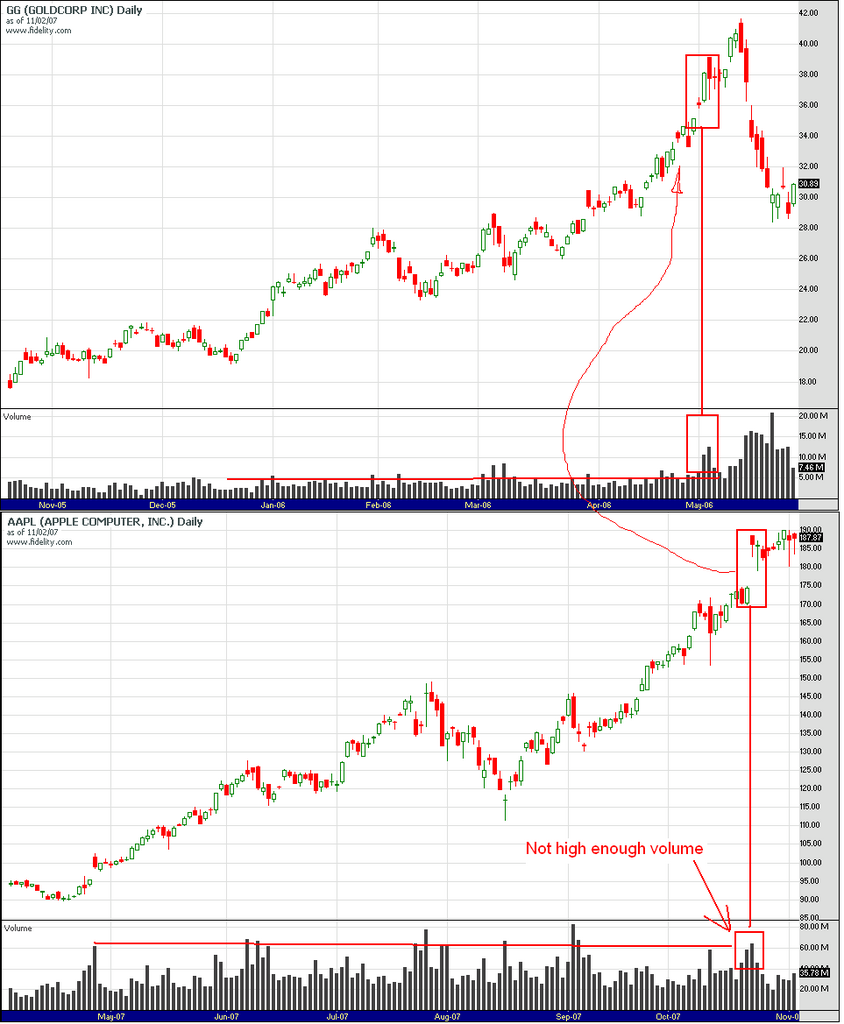
In this particular case (AAPL vs AAPL), it did not...

Posted Image

Edited by dcengr, 03 November 2007 - 04:26 PM.

Qui custodiet ipsos custodes?

#12 beta

beta

    lasergirl

  • TT Patron+
  • 4,093 posts

Posted 03 November 2007 - 04:30 PM

Dcengr, this is an excellent thread and discussion you've started. That AAPL 2000/2007 chart comparison is quite remarkable. I've wondered the same thing about parabolic moves, i.e., how does one know where they begin/end ? The one area Ive been studying on this topic is the Wyckoff pattern. I dont know enough to contribute to your discussion at this point, but there are lots of online resources on Wyckoff (rhymes with "blow off"). SemiBizz is quite knowledgeable about this. Also, in addition to GG, you might take a look at the earlier parabolic moves in many other commodity-related stocks like AKS and FRO from the 2003-2004 range. Thanks again for your posts.
"Daytrading -- An Extreme Sport !"

#13 dcengr

dcengr

    Member

  • Traders-Talk User
  • 13,391 posts

Posted 03 November 2007 - 04:30 PM

It could also be that parabolics are all naturally different and they do not share a characteristic that one can use to tell when each of them will die.

Newton's Second Law of Motion states:

"The rate of change of momentum of an object (or a price pattern's price) is directly proportional to the resultant force (or money flow) acting on it."

I need to find me some more parabolic stocks and do some comparisons.

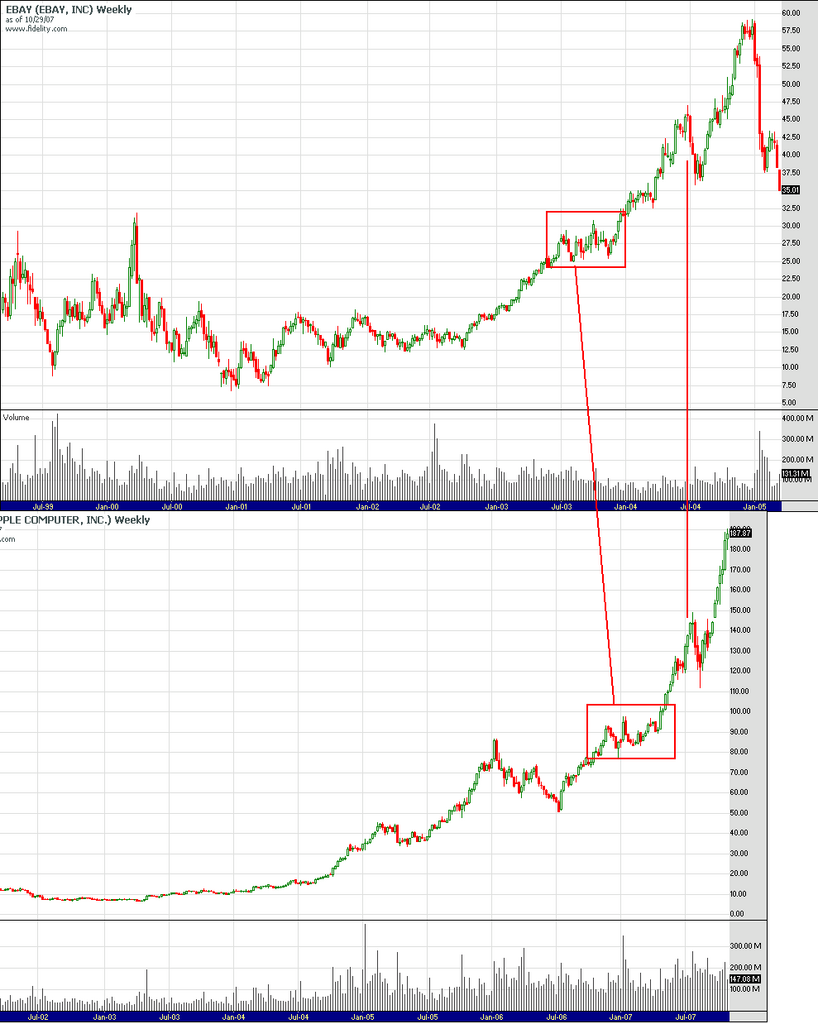
Don't forget to include inverted parabola patterns as well...it's not just a one way street.

Fib


How do you gage money flow acting on an individual stock? For an index its easy, but for an individual stock... I guess OBV or the like can be used, but parabolics tend to have the most thrust (price ROC and volume ROC) right before it dies.

As for inverse parabolics, yes that will be useful, but first things first.. this isn't the first time parabolics were mentioned and won't be the last. Theres some smart people out there that've learned somethings about these patterns, I'm sure, and any insight would be appreciated.
Qui custodiet ipsos custodes?

#14 beta

beta

    lasergirl

  • TT Patron+
  • 4,093 posts

Posted 03 November 2007 - 04:33 PM

... one other note on your volume analysis: it seems that often, the end of a parabolic move is marked by an extreme spike in buying volume followed by a spike in selling volume, i.e., long green/red bars in succession. Once this extreme volume/price reversal pattern forms, it sometimes takes years for a stock to base and then recoup those levels. This pattern seems to have been found on many gold/silver stock charts in the 80's (take a look at TGB, for example).

Edited by beta, 03 November 2007 - 04:36 PM.

"Daytrading -- An Extreme Sport !"

#15 dcengr

dcengr

    Member

  • Traders-Talk User
  • 13,391 posts

Posted 03 November 2007 - 04:43 PM

Here is AAPL compared to EBAY parabolics... note that only some of the features I've compared to vs GG are the same...

Posted Image
Qui custodiet ipsos custodes?

#16 fib_1618

fib_1618

    Member

  • Traders-Talk User
  • 10,145 posts

Posted 03 November 2007 - 04:51 PM

it seems that often, the end of a parabolic move is marked by an extreme spike in buying volume followed by a spike in selling volume

Newton's Third Law of Motion states:

"For every force acting on an object (or a price pattern's structure), the object will exert an equal, yet opposite, force on its cause."

And while we're at it, as it seems this thread is going in this direction, here is Newton's First Law of Motion that might help tie all of this together:

"An object (or a price pattern's structure) will remain at rest, or continue to move at a constant velocity, unless a resultant force acts on it."

There are many ways to gauge this same energy component, but the art of discovery in which this thread is trying to achieve needs to be maintained.

I'll be in the background....reading.

Fib

Better to ignore me than abhor me.

“Wise men don't need advice. Fools won't take it” - Benjamin Franklin


"Beware of false knowledge; it is more dangerous than ignorance" - George Bernard Shaw


Demagogue: A leader who makes use of popular prejudices, false claims and promises in order to gain power.

Technical Watch Subscriptions


#17 underabigw

underabigw

    Member

  • Traders-Talk User
  • 280 posts

Posted 03 November 2007 - 06:56 PM

I'm a novice here, but I think rate or angle of ascent can be used to see when a parabolic move is in progress. I think you had a mini parabolic move on the Apple chart in late Nov. to early Dec. '99. This mini parabolic move ultimately led to a correction back down to the point of the last breakout before the uptrend resumed. Great thread. UBW

#18 ogm

ogm

    Member

  • Traders-Talk User
  • 13,780 posts

Posted 03 November 2007 - 07:00 PM

Parabola is a highly speculative trend, aqnd parabolas end when all beleivers are in. When supply from early buyers willing to take profit starts overwhelming new buyers. As parabola starts losing momentum fear emerges not to lose profit and the downward move starts feeding on itself. when earlier holders start dumping to cash in on what was left of their profits and new holders are already sitting on losses. One thing for sure... every parabola ends in an extended downtrend. So expect AAPL and BIDU and ISRG to underperform for YEARS after the momentum exhausts itself. It doesn't have to be a deep decline, just an extended period of underperformance. Take a look at WMT of PFE charts for example. They were parabolas back in the day too. I think its pretty safe to start picking tops in AAPL already. On % basis it doesn't have that much left to run. Market cap is too big for parabolic trend to continue. Of course CSCO ran up to almost 500 bil market cap before plunging into teens from 80, but I think this isn't 2000 But my biggest bet is on ISRG here. I mean its a great company with great product. But the stock with 100 P/E, 2.4 PEG at 24 times sales... gimme a break. This one definitely doesn't have much room. A slightest slowdown in growth will kill the stock. Remember WFMI ? the flying grocery store ? That was painful for a while... but they all end the same.

Edited by ogm, 03 November 2007 - 07:07 PM.


#19 beta

beta

    lasergirl

  • TT Patron+
  • 4,093 posts

Posted 03 November 2007 - 07:23 PM

"For every force acting on an object (or a price pattern's structure), the object will exert an equal, yet opposite, force on its cause."


The rule of symmetry appears to have many useful applications in TA. Ive noticed that you use this concept effectively in your work interpreting rates of change (and direction) in momentum. Same rule applies to other TA concepts based on "force" IMHO (though I havent tested it extensively).

By example, here's a beautiful parabola -- the QCOM of commodities. If we assume that 68 was the "price fulcrum" (equilibrium point), note the near exact symmetry in the price extension from the bottom swing (19.31) to the top of the swing (19.15). Also note the symmetry in the angle of the top/bottom swings:

http://stockcharts.c...8127&r=8566.png


If this rule of symmetry holds here, this leg of the parabola should top around 87.6 (or already has). IF key support at 75 holds, I believe the final leg of this parabola will extend to 110's. If not, we've probably seen wave "5" in this phase of the CommodityBull, and BHP should fall back to the 45 range before the next major advance begins. Based on the angle of descent of the bisecting vector, BHP should bottom around May 2008 under the latter scenario.

Edited by beta, 03 November 2007 - 07:29 PM.

"Daytrading -- An Extreme Sport !"

#20 ogm

ogm

    Member

  • Traders-Talk User
  • 13,780 posts

Posted 03 November 2007 - 07:46 PM

wow.. missed the BHP.. Going to be a beautiful short. I think its pretty safe to short it here already. Multiple divergences and broken MACD's on daily massive volume churning at these levels. Distributive.

Edited by ogm, 03 November 2007 - 07:52 PM.