 For speculation entertainment only.
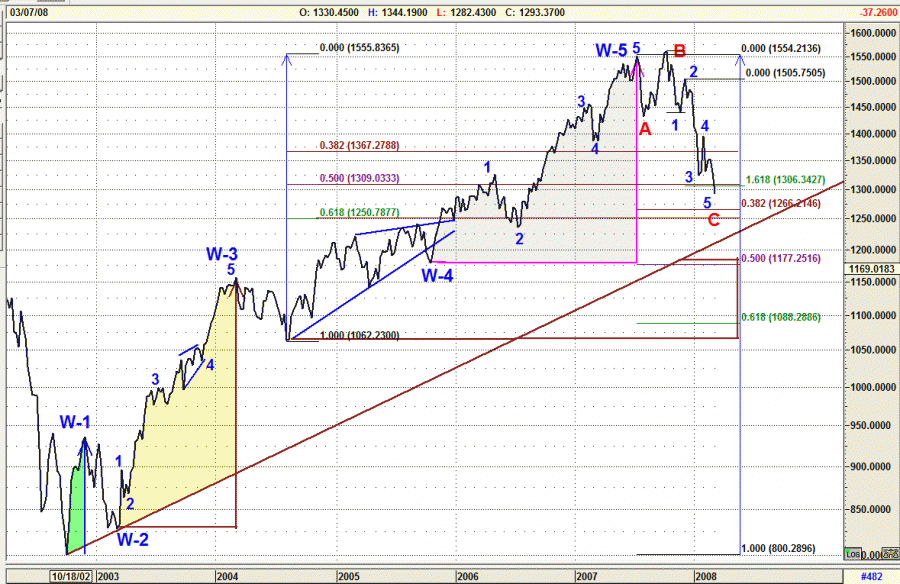
Time to take another look at the larger super cycle wave pattern since we made a new weekly close Friday. I may be the only market analysts in the world that believes the July 2007 high was the high for all cycles that go back over 300 years. This pattern as of this week continues to follow my analysis as expected. A weekly close near 1309 to 1306 was the wave “5” target zone for the wave “C” and we got it Friday. That completes one wave down.
A wave “B” rally toward the election would be next, a decline, and another bounce rally into early 2009 occurs before the monster wave “C” begins. Odds are this 1282 low is just the first wave down of a larger pattern that will drop the markets into the price zone of the 1994 trading range and even that will be just the first wave down of the even larger wave pattern.
Using standard wave Fibonacci techniques a bounce to the 50% retrace at the wave “B” 1428 area is extended by the 1.618, 2.618 and 4.25 ratios targets SP-500 levels of 988, 715, 271 within a Fibonacci 3, 5 or 8 years.
Best,
Larry
Super Cycle top update
#1

Posted 08 March 2008 - 01:50 PM
 For speculation entertainment only.
Time to take another look at the larger super cycle wave pattern since we made a new weekly close Friday. I may be the only market analysts in the world that believes the July 2007 high was the high for all cycles that go back over 300 years. This pattern as of this week continues to follow my analysis as expected. A weekly close near 1309 to 1306 was the wave “5” target zone for the wave “C” and we got it Friday. That completes one wave down.
A wave “B” rally toward the election would be next, a decline, and another bounce rally into early 2009 occurs before the monster wave “C” begins. Odds are this 1282 low is just the first wave down of a larger pattern that will drop the markets into the price zone of the 1994 trading range and even that will be just the first wave down of the even larger wave pattern.
Using standard wave Fibonacci techniques a bounce to the 50% retrace at the wave “B” 1428 area is extended by the 1.618, 2.618 and 4.25 ratios targets SP-500 levels of 988, 715, 271 within a Fibonacci 3, 5 or 8 years.
Best,
Larry
#2

Posted 08 March 2008 - 02:08 PM
#3

Posted 08 March 2008 - 02:20 PM
Hello Larry,
Thanks for the update.
If Friday's low is violated, does that put a kibosh on an imminent rally?
Also, any targets for the rally?
Thanks again,
Joe
Greetings Joe,
You may see an open lower that is quickly reversed however the pattern off the 1282 low does have the right look on a 5 min chart to have a low in place so it could open higer from the get go. My ETF SnP breadth model will switch to BUY SSO Monday even if all 500 stocks closed down and this model has been spot on since the December high.
Targets are down cycle week high 1319, got to get above 1319 this week to start the multi month up bias toward a June high. Max up this week is 1350 so any daily close between 1319 and 1350 continues my favored bullish outlook into a 1416-1436 summer high.
Best,
Larry
#4

Posted 08 March 2008 - 02:29 PM
Richard Wyckoff - "Whenever you find hope or fear warping judgment, close out your position"
Volume is the only vote that matters... the ultimate sentiment poll.
http://twitter.com/VolumeDynamics http://parler.com/Volumedynamics
#5

Posted 08 March 2008 - 02:47 PM
Hi Larry... Just looked at the hourly SPX, sure looks to me like an ABC Down to 1260, with an expected light volume test of 1302...
Using standared Elliott wave momentum analysis it is a wave 1, 2, 3 low at 1282 with 1319 as wave 4 target. Like I stated, we fail to get above 1319 this week then we go lower. My reason for calling March 7th as the 1270 retest low is based on natural time cycle theory. We have two time windows in March for a low, March 7th amd March 19/20th. The Natural interaction of the Moon/Earth has the strongest down cycle pressure for March in the week of March 7th so I have to go with that.
Larry
#6

Posted 08 March 2008 - 02:51 PM

2000, 2003 (major turns) both came on 1st quarter... 2007... last quarter and 2007 was a minor turn(per length of time in move)
...
We are having a major turn here off the full downtrend that began in July..
For quick reference for moon phases here:
http://www.life-cycl...3-2004-2005.htm
Edited by SemiBizz, 08 March 2008 - 03:00 PM.
Richard Wyckoff - "Whenever you find hope or fear warping judgment, close out your position"
Volume is the only vote that matters... the ultimate sentiment poll.
http://twitter.com/VolumeDynamics http://parler.com/Volumedynamics
#7

Posted 08 March 2008 - 03:14 PM
Well, we differ completely on the turn date. Looking at the past history. 3/12/2003, 3/10/2000, 3/15/2007 turns. Then I took a look at the moon phases... See below:
2000, 2003 (major turns) both came on 1st quarter... 2007... last quarter and 2007 was a minor turn(per length of time in move)
...
We are having a major turn here off the full downtrend that began in July..
For quick reference for moon phases here:
http://www.life-cycl...3-2004-2005.htm
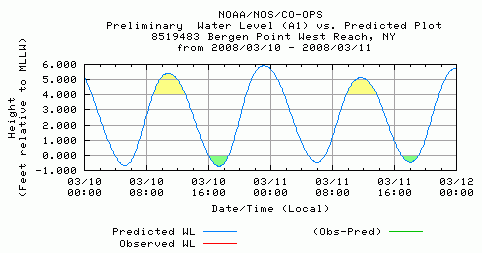
The phase of the Moon is not what generates cycles, it is the Apogee-Perigee and lattitude declination that generates the cycles. We can see this visually in an Ocean tide chart. During an up bias week tides will be decreasing in strength and during down bias weeks tides will be increasing in strength. Here is this weeks tide chart, note every day of the week the high tide is lower and the low tide is higher. Result, an up bias week.
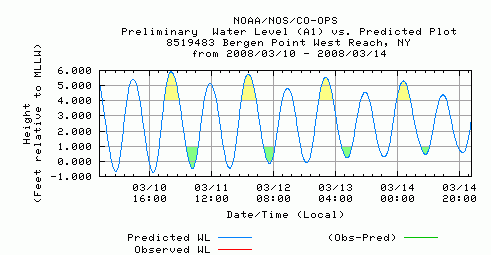
Mondays tide
#8

Posted 08 March 2008 - 03:23 PM
#9

Posted 08 March 2008 - 03:33 PM
Larry,
Does the April 10/11th time frame mean anything to you based on a cyclic standpoint?
I have a four month series low in that time frame and an annual cycle low due the first week of April +/- a week so yes there is a cycle cluster in that time frame. This week I need to see what happens at 1319-1324, that is a monthly weekly time frame projection and if we get past it then the March 7th low was the lowest daily close low until the election.
Larry
#10

Posted 08 March 2008 - 03:38 PM
The phase of the Moon is not what generates cycles.
Show me the proof.
I gave you couple strong examples. 2000, 2003. Let's see what your tidal chart says.
Richard Wyckoff - "Whenever you find hope or fear warping judgment, close out your position"
Volume is the only vote that matters... the ultimate sentiment poll.
http://twitter.com/VolumeDynamics http://parler.com/Volumedynamics


