thanks larry, but i think 1250 to 1220 more likely. please see my post below.

Super Cycle top update
Started by
LarryT
, Mar 08 2008 01:50 PM
29 replies to this topic
#11

Tor
-

- Traders-Talk User
- 7,647 posts
Member
Posted 08 March 2008 - 03:52 PM
Observer
The future is 90% present and 10% vision.
The future is 90% present and 10% vision.
#12
LarryT
-
- Traders-Talk User
- 1,066 posts
Member
Posted 08 March 2008 - 03:57 PM
The phase of the Moon is not what generates cycles.
Show me the proof.
I gave you couple strong examples. 2000, 2003. Let's see what your tidal chart says.
Last weeks tide chart had higher tide heights and lower low tides increasing every day of the week = a down bias week. The lowest low tide in March occurs today and Sunday. Friday was a four day cycle day four so my weekly analysis last weekend was the weekly projected low at 1297 to monthly up cycle projected low 1285 would be the weekly low target. Nuff for ya?
 Trying to give some clues here what generates cycles. The Delta theory book and Robert Taylors book explains how these cycles are generated. The proof will be this coming week.
#13
SemiBizz
-

- Traders-Talk User
- 23,208 posts
Volume Dynamics Specialist
Posted 08 March 2008 - 04:06 PM
Last week's action of short term ups and downs is hardly empirical evidence regarding important turns in the market. Now do this for me, sit down with your SPX chart and look at the turns, look at the dates and just see how many 1st quarter moon (or in proximity to first quarter) turns you see... answer.. A lot. Here's a few 4/14/97, 12/17/96, 12/9/94, 12/2/91. How about the July High you keep referring to? First Quarter 7/22... when was the high 7/20? 7/22 was Sunday.
Last weeks tidal chart is not enough of a benchmark. But go ahead, take the SPX chart out and run it against the phases of the moon. Arch Crawford makes a living off of this, it doesn't take a PhD.
Price and Volume Forensics Specialist
Richard Wyckoff - "Whenever you find hope or fear warping judgment, close out your position"
Volume is the only vote that matters... the ultimate sentiment poll.
http://twitter.com/VolumeDynamics http://parler.com/Volumedynamics
Richard Wyckoff - "Whenever you find hope or fear warping judgment, close out your position"
Volume is the only vote that matters... the ultimate sentiment poll.
http://twitter.com/VolumeDynamics http://parler.com/Volumedynamics
#14
SemiBizz
-
- Traders-Talk User
- 23,208 posts
Volume Dynamics Specialist
Posted 08 March 2008 - 04:46 PM
http://tidesandcurrents.noaa.gov/cgi-bin-mp/data_plot.cgi?mins=&datum=6&relative=&wl_sensor_hist=W2&unit=1&stn=8519483&datum=6&bdate=20030302&edate=20030331&data_type=wl&type=Historic%20Tide%20Data&shift=g&wl_sensor_hist=W2&plot_backup=$.gif
2003 doesn't hold water for your theory.
2003 doesn't hold water for your theory.
Edited by SemiBizz, 08 March 2008 - 04:47 PM.
Price and Volume Forensics Specialist
Richard Wyckoff - "Whenever you find hope or fear warping judgment, close out your position"
Volume is the only vote that matters... the ultimate sentiment poll.
http://twitter.com/VolumeDynamics http://parler.com/Volumedynamics
Richard Wyckoff - "Whenever you find hope or fear warping judgment, close out your position"
Volume is the only vote that matters... the ultimate sentiment poll.
http://twitter.com/VolumeDynamics http://parler.com/Volumedynamics
#15
SemiBizz
-
- Traders-Talk User
- 23,208 posts
Volume Dynamics Specialist
Posted 08 March 2008 - 04:49 PM
http://tidesandcurrents.noaa.gov/cgi-bin-mp/data_plot.cgi?mins=&datum=6&relative=&wl_sensor_hist=W2&unit=1&stn=8519483&datum=6&bdate=20000302&edate=20000331&data_type=wl&type=Historic%20Tide%20Data&shift=g&wl_sensor_hist=W2&plot_backup=$.gif
2000 doesn't fit your model either.
2000 doesn't fit your model either.
Price and Volume Forensics Specialist
Richard Wyckoff - "Whenever you find hope or fear warping judgment, close out your position"
Volume is the only vote that matters... the ultimate sentiment poll.
http://twitter.com/VolumeDynamics http://parler.com/Volumedynamics
Richard Wyckoff - "Whenever you find hope or fear warping judgment, close out your position"
Volume is the only vote that matters... the ultimate sentiment poll.
http://twitter.com/VolumeDynamics http://parler.com/Volumedynamics
#16
SemiBizz
-
- Traders-Talk User
- 23,208 posts
Volume Dynamics Specialist
Posted 08 March 2008 - 05:18 PM
If I understand you correctly, the market should have been moving HIGHER into 9/11/2001...
http://tidesandcurrents.noaa.gov/cgi-bin-mp/data_plot.cgi?mins=&datum=6&relative=&wl_sensor_hist=W1&unit=1&stn=8519483&datum=6&bdate=20010824&edate=20010921&data_type=wl&type=Historic%20Tide%20Data&shift=g&wl_sensor_hist=W1&plot_backup=$.gif
http://bigcharts.mar...&mocktick=1.gif
http://tidesandcurrents.noaa.gov/cgi-bin-mp/data_plot.cgi?mins=&datum=6&relative=&wl_sensor_hist=W1&unit=1&stn=8519483&datum=6&bdate=20010824&edate=20010921&data_type=wl&type=Historic%20Tide%20Data&shift=g&wl_sensor_hist=W1&plot_backup=$.gif
http://bigcharts.mar...&mocktick=1.gif
Price and Volume Forensics Specialist
Richard Wyckoff - "Whenever you find hope or fear warping judgment, close out your position"
Volume is the only vote that matters... the ultimate sentiment poll.
http://twitter.com/VolumeDynamics http://parler.com/Volumedynamics
Richard Wyckoff - "Whenever you find hope or fear warping judgment, close out your position"
Volume is the only vote that matters... the ultimate sentiment poll.
http://twitter.com/VolumeDynamics http://parler.com/Volumedynamics
#17
kc135a
-

- Traders-Talk User
- 501 posts
Member
Posted 09 March 2008 - 12:47 AM
For speculation entertainment only.
Time to take another look at the larger super cycle wave pattern since we made a new weekly close Friday. I may be the only market analysts in the world that believes the July 2007 high was the high for all cycles that go back over 300 years. This pattern as of this week continues to follow my analysis as expected. A weekly close near 1309 to 1306 was the wave 5 target zone for the wave C and we got it Friday. That completes one wave down.
A wave B rally toward the election would be next, a decline, and another bounce rally into early 2009 occurs before the monster wave C begins. Odds are this 1282 low is just the first wave down of a larger pattern that will drop the markets into the price zone of the 1994 trading range and even that will be just the first wave down of the even larger wave pattern.
Using standard wave Fibonacci techniques a bounce to the 50% retrace at the wave B 1428 area is extended by the 1.618, 2.618 and 4.25 ratios targets SP-500 levels of 988, 715, 271 within a Fibonacci 3, 5 or 8 years.
Best,
Larry
Hi Larry
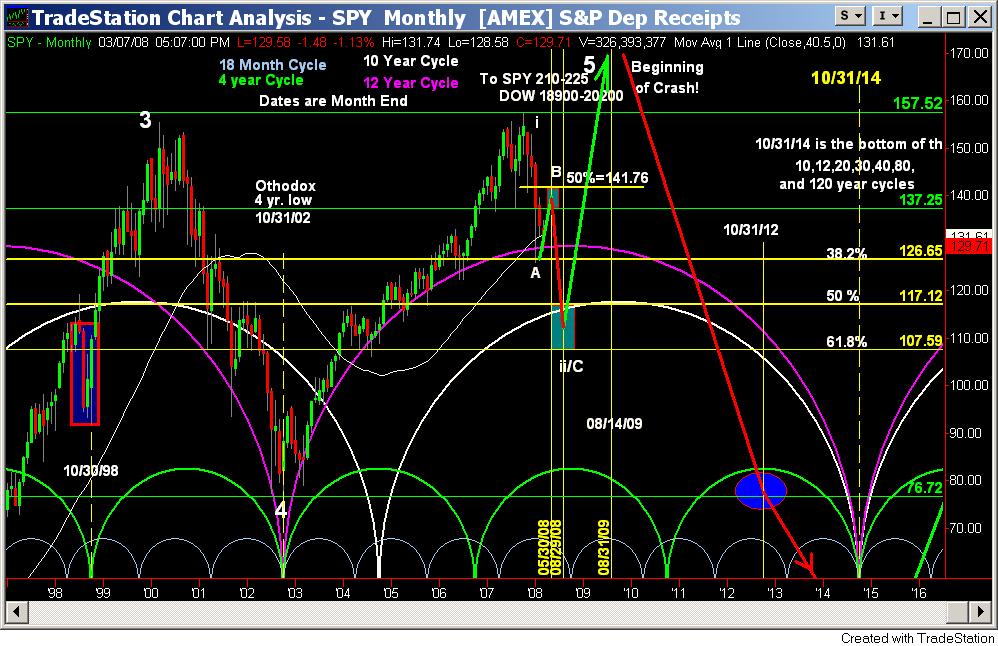
I have a different take that is looking for a lower low late August of this year leading to a blow off terminal rally into Fall 2009 and possibly as late as Fall 2010. After that, we both agree it is going to be very ugly.
For giggles, the final top is projected on 8/14/2009.
My primary driver for this forecast is the 40 year cycle low due October 2014 which also goes back several hundred years to those who are interested enough to study a little history.
I am certain someone is going to jump all over the ewave counts and fib projections. The chart is all about major cycle lows and the rest just enhances the view from now to then.
#18
dasein
-

- Traders-Talk User
- 7,696 posts
Member
Posted 09 March 2008 - 05:33 AM
Thanks as always for your input.
I was looking for a IT top in april, but your charts offer food for thought.
klh
best,
klh
klh
#19
LarryT
-
- Traders-Talk User
- 1,066 posts
Member
Posted 09 March 2008 - 06:23 AM
[quote name='SemiBizz' date='Mar 8 2008, 07:18 PM' post='357212']
If I understand you correctly, the market should have been moving HIGHER into 9/11/2001...
You do not understand me at all. Year 2000 to 2001 was a down cycle year. Forces are opposite in a down cycle. It is a lot more complicated than what I revealed. As we get within the full moon before and after the spring equinox a shift in forces that generate cycles can occur and the forces can be opposite to what they are now. I am done with this.
#20
SemiBizz
-
- Traders-Talk User
- 23,208 posts
Volume Dynamics Specialist
Posted 09 March 2008 - 11:18 AM
You do not understand me at all
Finally, something we can agree on...

Price and Volume Forensics Specialist
Richard Wyckoff - "Whenever you find hope or fear warping judgment, close out your position"
Volume is the only vote that matters... the ultimate sentiment poll.
http://twitter.com/VolumeDynamics http://parler.com/Volumedynamics
Richard Wyckoff - "Whenever you find hope or fear warping judgment, close out your position"
Volume is the only vote that matters... the ultimate sentiment poll.
http://twitter.com/VolumeDynamics http://parler.com/Volumedynamics


