
It's not a day to day or even week to week timing tool, but rather more of a general gage of sentiment- and I believe a good one. And like any sentiment gage, I use it as a warning, if you will, that if it is confirmed by momentum shouldn't be ignored. Much like the point I was making on March 7, 2009 in the below post, that the reading at that time of 70% bearish on AAII was a warning that any change in momentum to the upside should be heeded. And indeed that upside momentum signal came a few days later with the SSBS on 3-10-09. But these sentiment gages do NOT stand on their own as timing tools, as explained below.
Just my thoughts on what record bearishness, and deep momentum divergences are telling us, as traders, and perhaps more importantly, what they are NOT telling us, fwiw.

Record AAII bearishness (in it's 25 year historical record) cannot and should not be ignored, imho. BUT....I've always maintained that sentiment alone cannot be used as a timing signal, per se, because it only measures potential for the next move, which is very important to monitor and know, but it still doesn't tell you WHEN the move will occur. IOW, while it's true that over the years, important bottoms have coincided with peak bearishness, the fact remains that in real time, we cannot know what the peak bearishness reading will be. 70% is a RECORD. That's highly significant. But will it peak here? Or at 75%? or 80%? Or 90%? We can't know.
So are record AAII bearishness and massive divergent readings in internal market momentum of no value to a trader? Far from it! They tell him two things...the potential size and duration of a subsequent move, and that the time has come to be alert to a trend change.
Now for the last piece of the puzzle....when? IMHO, we will know when the IT advance has begun when momentum itself turns up. Price follows momentum. I use SS's for that purpose. Other traders use different measures. Still others use pure price trends, and of course, that's a completely valid approach as well, as proven by successful traders here.
So it is with these readings, imho. It's a rainy day in Waikiki, so what the heck!
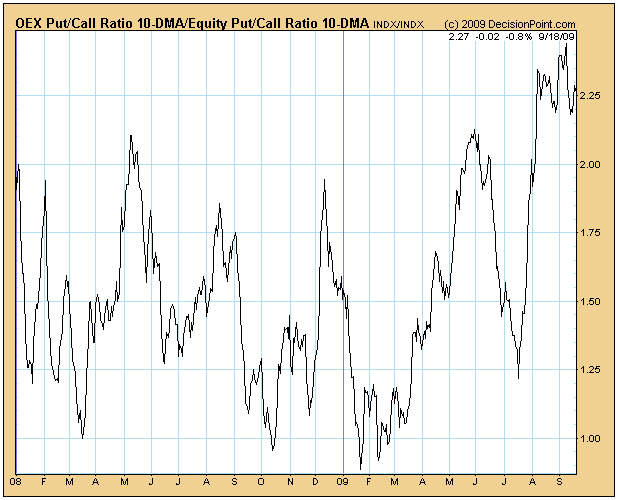
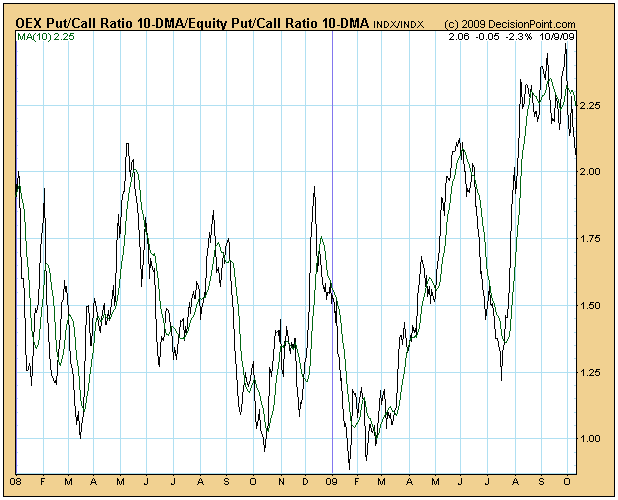
 I stayed indoors and dug into this the charts a bit. I went back over this entire decade and looked at when the 20-day EMA of this newly constructed indicator exceded 2.00 and where that was on the charts, so as to add some perspective to what information may be contained here. Here's 2009 and 2003 as examples of what I mean:
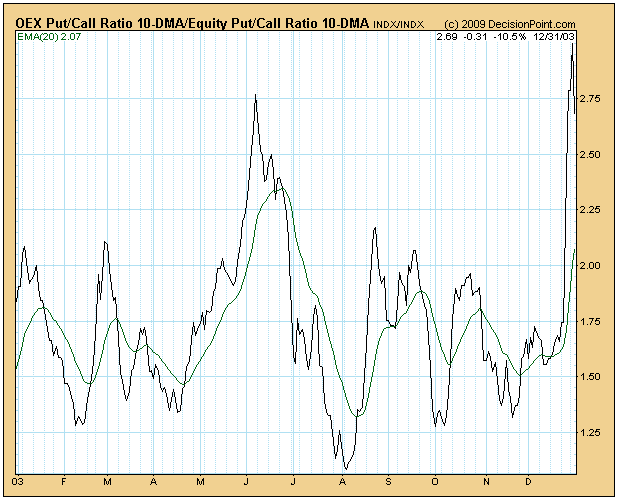

In 2003, for example, there was on brief period in Jun when the EMA ventured over 2, and the peak was on 6-20-03 as marked.
I did that year by year from Jan 1, 2000 right up to today, then went back and marked the chart below to show when the readings of >2.00 on 20-day EMA occurred. I circled all tme periods where the EMA remained above 2 for more than four weeks, and marked the peak point of the EMA with a down arrow during those times when it popped above 2 then dropped below in less than a four week period.
Notice that Most of 2000 and most of 2007 were over 2- Cyclical Bull Market tops preceding drops of 50% or more in the years that followed. But most periods of >2 were just a matter of days, and tended to come at.....well I'll let you be the judge of that.
http://stockcharts.com/c-sc/sc?s=$SPX&p=W&st=2000-01-01&i=p61831934805&a=177361222&are=603.png
But let me emphasize one more time- I look at this as a warning, NOT a signal of any kind. It's just information that goes into the the mix. I have and will continue to use momentum signals for specific timing. Best, D
Edited by IYB, 06 September 2009 - 08:11 PM.

 . The signals in Nov 05 and Aug 06 were simply plain wrong.
Sometimes the PCR instead of indicating a certain level of fear when it rises, may be indicating the applied hedges to the opposite sentiment that could in fact be a very bullish net position. Toss in that it is a ratio of OEX and general equity positions, the margin of error goes up even more.
Hope today is a sunnier day out there.
Echo
. The signals in Nov 05 and Aug 06 were simply plain wrong.
Sometimes the PCR instead of indicating a certain level of fear when it rises, may be indicating the applied hedges to the opposite sentiment that could in fact be a very bullish net position. Toss in that it is a ratio of OEX and general equity positions, the margin of error goes up even more.
Hope today is a sunnier day out there.
Echo

 }
}


 Something strange is brewing.....
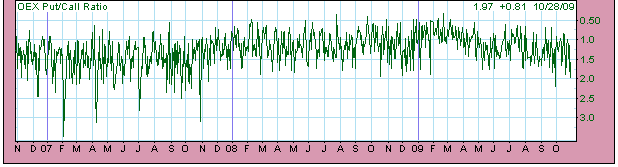


