Jump to content


Photo

Jaws II


  • Please log in to reply
46 replies to this topic

#31 dowdeva

dowdeva

    Member

  • Traders-Talk User
  • 525 posts

Posted 06 August 2009 - 11:20 PM

COB 8-06-09 we have another 2008/2009 new high reading, which by bear market standards would say the top is likely in:


Respectfully, I don't agree: A high reading doesn't necessarily mean a top is in. Today or tomorrow is the window for a Hurst 1.25 week, or 6 to 7 day, low. I am thinking the low will be around 11 to 11:30, and so far, looks good to rally again from there due to the fact that the drop is extremely right translated (i.e., the high for this cycle is late rather than early) into WWW.

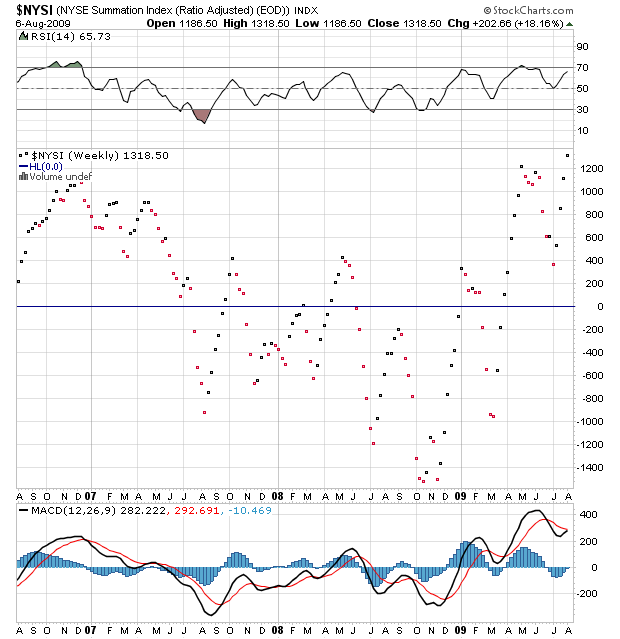
NYSI shows a similarly high reading to the indicator in your chart. The separation between the postings on the daily are exceptionally wide, indicating strong money flow coming in, the angle of ascent is steep, there is still a 'bottoms above bottoms' structure in place, and the high today exceeds the high in May, along with a higher top on the index. Would look for a double or even triple divergence before placing serious shorts.

However, I think the seeds for a bear case are beginning to finally sprout, in that stochastics on the dailys for many indexes seems to be forming about 1/2 of a rounded topping pattern (some serious distribution going on), and that NASI is actually showing a pattern of lower lows as opposed to NYSI. Tech not keeping up with this rally. Very not good, as it is all America really has left, IMO. Also, divergence on the 14 day RSI on weekly and daily, on this last NYSI high as opposed to the prior high. And finally, the 40 week Hurst cycle has topped and is starting to get a little 'long in the tooth.' If this is truly a bear market rally, and not the beginnings of a bull market, the top here should NOT be right-translated, but should be topping right here, right now.

To recap, so far this looks like a temporary swing short, that should be bought at a ST low.

scnysi0806.png


Ps: Ya' know, after all this complicated analysis, I really think the prez cycle is going to call the shots.

Edited by dowdeva, 06 August 2009 - 11:24 PM.


#32 Will

Will

    Member

  • Traders-Talk User
  • 363 posts

Posted 07 August 2009 - 12:11 PM

COB 8-06-09 we have another 2008/2009 new high reading, which by bear market standards would say the top is likely in:


It could be argued that since the market keeps rallying on high readings the context has changed.

#33 IYB

IYB

    Member

  • TT Patron+
  • 7,141 posts

Posted 07 August 2009 - 04:52 PM

COB 8-06-09 we have another 2008/2009 new high reading, which by bear market standards would say the top is likely in:


It could be argued that since the market keeps rallying on high readings the context has changed.

Absolutely correct Will. Context indeed is everything, and that's why I worded that statement as I did. Regards and mahalo again for the heads up on the DP system. Don
“Men, it has been well said, think in herds; it will be seen that they go mad in herds, while they only recover their senses slowly, one by one.” Charles Mackay, Extraordinary Popular Delusions and the Madness of Crowds

#34 IYB

IYB

    Member

  • TT Patron+
  • 7,141 posts

Posted 24 August 2009 - 04:14 PM

Update 8-24-09: Extremely bearish by bear market standards. Moderately bearish by bull market standards. While the timing may be only approximate of course, in the past, as the "jaws close" indicated by this indicator declining, the market declines: 000064.png

Edited by IYB, 24 August 2009 - 04:20 PM.

“Men, it has been well said, think in herds; it will be seen that they go mad in herds, while they only recover their senses slowly, one by one.” Charles Mackay, Extraordinary Popular Delusions and the Madness of Crowds

#35 entre

entre

    Member

  • Traders-Talk User
  • 880 posts

Posted 24 August 2009 - 04:55 PM

Great seein' you here UFO. Missed ya'. I hear ya' about the money supply, Bro, but we are fighting a major deflationary trend, so who will win? The Fed or the forces of nature? We know the answer to that question in Japan over nearly two decades. Wasn't the fed.

But all that aside, all I care is one simple thing -- what's the stock market trend as defined by internals? Let others argue whether we are inflating or deflating. Which force is stronger? My job is only to identify the prevailing trend of the stock market, pure and simple. Period.

Not sayin' your argument won't turn out to be the right one. It absolutely may be. Just sayin' I will look only to the market for that decision, not the funnymentals.

Take good care. D


With respect to the Fed or the forces of nature...I think the answer is which one is larger sizewise...the Fed effort is in the trillions(leveraged out)...and so is the market cap in the spx...so for the first time the Fed is on par with nature sizewise.

I really wonder what percentage gains in marketcap since the march low are attributed to the Fed. I have no idea but I wouldn't be surprised if it was 50%...say a few hundred billion of direct Fed injections leveraged 10 to 1 by the primary dealers and that's a extra few trillion to buy stocks with.

The HYG is starting to lag though...and the Fed buying program is coming to an end.

There are two things that suprised me...that the Fed would be this aggressive...and that the spx would only make it to 1000 and change on this type of aggressiveness. In the move off the 2003 lows the Fed injections were much much smaller and the market seemed stronger.

I'd be interested if someone came up with an indicator of "internals per unit fed injection"...like some composite of high lows and advance declines relative to the size of the fed asset purchases...with the idea being when the fed is hardly getting the bang for its buck anymore the market is vulnerable...something to account for the size of the fed because it's wrecking havoc on traditional indicators.

#36 IYB

IYB

    Member

  • TT Patron+
  • 7,141 posts

Posted 25 August 2009 - 06:00 PM

Here's the longer term look thru today. Again, current numbers would be considered extreme for a bear environment, only moderate for bull context. Either way though, clearly OEX players are a whole lot more bearish than the equity option gang: 000065.png
“Men, it has been well said, think in herds; it will be seen that they go mad in herds, while they only recover their senses slowly, one by one.” Charles Mackay, Extraordinary Popular Delusions and the Madness of Crowds

#37 IYB

IYB

    Member

  • TT Patron+
  • 7,141 posts

Posted 31 August 2009 - 11:35 PM

000076.png
“Men, it has been well said, think in herds; it will be seen that they go mad in herds, while they only recover their senses slowly, one by one.” Charles Mackay, Extraordinary Popular Delusions and the Madness of Crowds

#38 IYB

IYB

    Member

  • TT Patron+
  • 7,141 posts

Posted 05 September 2009 - 07:55 PM

00082.png 000081.png 000083.png Here are the two components individually, once again. Notice that the OEX option players in the middle chart above are now buying puts at the heaviest level since November 2007 (and equal to Dec 2008). Even a casual study of the accompanying OEX chart and longer term charts as well show that, generally speaking, to fade them has not been a winning strategy over time. ;) D

Edited by IYB, 05 September 2009 - 07:57 PM.

“Men, it has been well said, think in herds; it will be seen that they go mad in herds, while they only recover their senses slowly, one by one.” Charles Mackay, Extraordinary Popular Delusions and the Madness of Crowds

#39 Echo

Echo

    Member

  • Traders-Talk User
  • 2,273 posts

Posted 06 September 2009 - 12:53 PM

00082.png
000081.png
000083.png

Here are the two components individually, once again. Notice that the OEX option players in the middle chart above are now buying puts at the heaviest level since November 2007 (and equal to Dec 2008). Even a casual study of the accompanying OEX chart and longer term charts as well show that, generally speaking, to fade them has not been a winning strategy over time. ;) D


I just don't see it as a short term timing tool, Don. It is completely hit or miss. Strange that the OEX players lived between 1.25 and 2.0 during most of 2007 (and mostly between 1.50 and 2.00) when we were in a bull market. Since Oct 2007 and during the worst bear market drop in decades, they haven't even SEEN the 1.5-2.0 range ONCE. Come on. The should have been parked at the 1.75-2.0 range for 1+ years till March 09 if they were playing this right. Either they suck at this (I doubt it) or this measure is generally a poor tool for a very simple reason. Same reason I've given on this board for the past 5 years.

We simply don't know what their total position is. What is on the other side (or 3 or 4 sides) of their options positions. Are they long a basket of OEX stocks against it? Are they in multi-strike spreads or conversions or arbitrage positions? Are they puts on INVERSE ETFs. Nobody has a clue cuz it is a mixed bag of the OEX universe. So if you look at specific examples on the chart, its hit or miss.

Mid Feb 07 they get wildly bearish then pop back to the middle of their range. Then we get the 1 day huge drop on the last day of Feb, after they gave up on it. Peak bearishness mid April 07 failed, OEX went up. Peak bearishness May 07-- a wash. Peak bearishness July 07, right before another pop upside. Peak bullishness early August too early, another big drop down in OEX.

More recently, the Dec 08 peak in bearishness was pretty good, but the late May 09 was right before another pop in OEX early Jun.

The mid June peak bearishness was right on into the July lows, but repeat peak bearishness at the same or more extreme levels in mid August was right into the next pop up in OEX. Now we are even more bearish on the OEX PCR than June-Aug. Do you feel confident that this marks a near term top? We are not even in the neighborhood where they lived for most of 2007! What if the ratio goes to 1.75 or even 2.0? Well, they weren't so good indicators back in 2007 either, unless perhaps you are willing to leave a 2-4 week window for them to eventually be right, by which time, the market could easily have enough upside to run any reasonably placed stops as seen in this 3 year hx you've provided.

It all comes back to not knowing really what the positions are and what they are against. If you could know their entire position, bullish or bearish, then you could evaluate if they were right or wrong and how good they tend to be. But the OEX options can be used by anyone and I suspect you are dealing with a diverse heterogenous group of traders that are more sophisticated than just trading OEX options. You could try to get more sophisticated with the analysis with dollar weighting and looking at ratios to the equity options, but at the end of the day, it tends to be a blunt tool, not anything you can hang your hat on for this weeks trading. You definitely don't want to get married to a stance based on this indicator.

Just my opinion.

Echo

#40 IYB

IYB

    Member

  • TT Patron+
  • 7,141 posts

Posted 06 September 2009 - 02:57 PM

00082.png
000081.png
000083.png

Here are the two components individually, once again. Notice that the OEX option players in the middle chart above are now buying puts at the heaviest level since November 2007 (and equal to Dec 2008). Even a casual study of the accompanying OEX chart and longer term charts as well show that, generally speaking, to fade them has not been a winning strategy over time. ;) D


... it tends to be a blunt tool, not anything you can hang your hat on for this weeks trading. You definitely don't want to get married to a stance based on this indicator.

I absolutely agree, Doc. And yes, there is clearly room for the ratio of OEX to Equity to go higher before heading down, and for the equity ratio to go lower. But ultimately I believe it will have pointed out a high risk area in the market. We won't know the peak OEX put/call ratio reading until we look back later, but the peak OEX put buying HAS coincided with market peaks over the years regardless of what range they are in or the market environment. I do not use it as a timing signal for the week ahead, but as you say, as an overall indication of sentiment- much like the InvIntel or AAII numbers- though, I believe, more reliable. While the info is incomplete as to any trader's positions, the correlation with the market of both OEX AND the equity PCR have endured over decades, and I believe this will be no exception. Regards, D

Edited by IYB, 06 September 2009 - 03:07 PM.

“Men, it has been well said, think in herds; it will be seen that they go mad in herds, while they only recover their senses slowly, one by one.” Charles Mackay, Extraordinary Popular Delusions and the Madness of Crowds