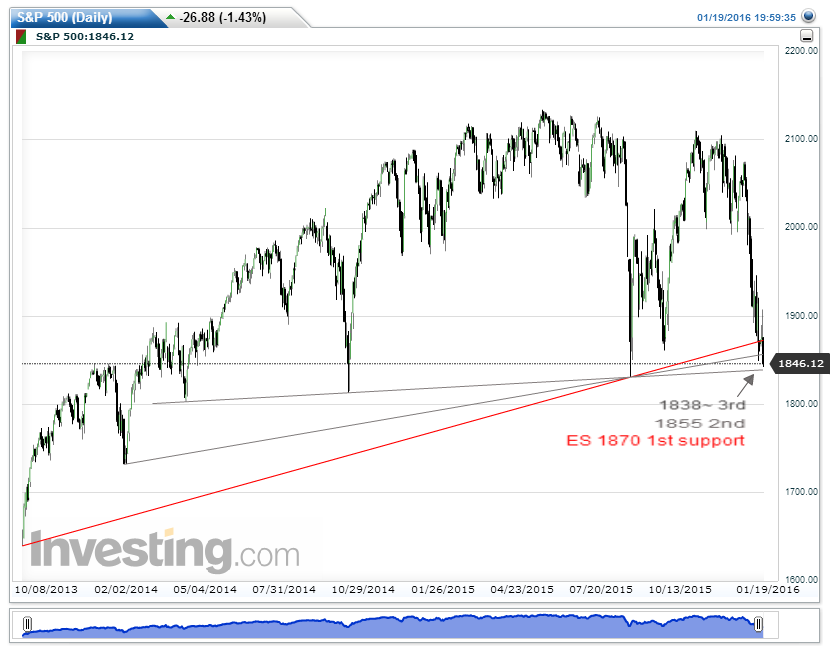
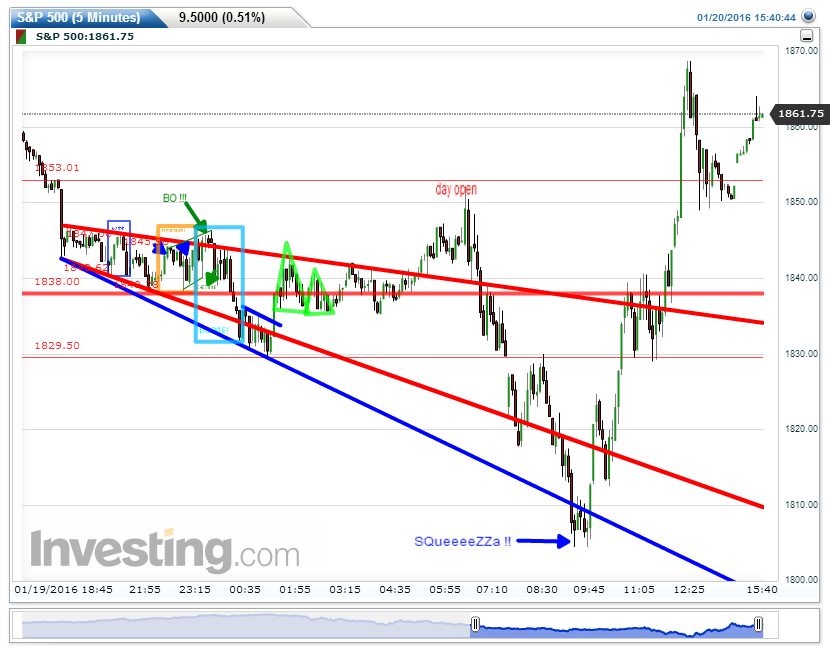
ES 1838 is the last support per chart I posted Jan 13, now as I type we lost the 2nd support 1855 on interim daily stick.
http://www.traders-t...-said/?p=738825

iloli = I'm Laws Of Line's I(eye)

Posted 19 January 2016 - 11:11 PM
ES 1838 is the last support per chart I posted Jan 13, now as I type we lost the 2nd support 1855 on interim daily stick.
http://www.traders-t...-said/?p=738825
Member

Member

Posted 20 January 2016 - 10:39 AM
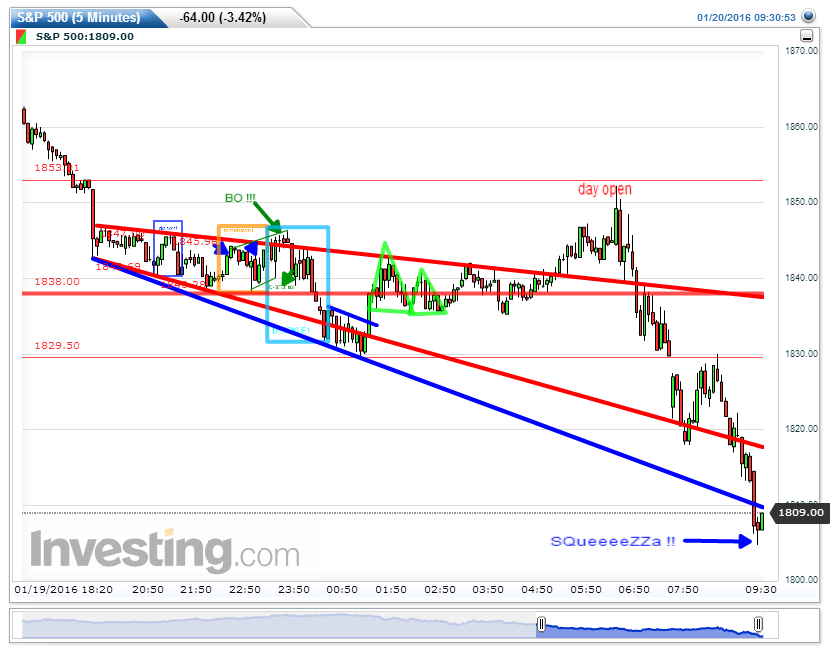
es is already sub 1830 - surprising to me too...
iloli = I'm Laws Of Line's I(eye)
Posted 20 January 2016 - 02:47 PM
On EOD, not intraday, to close above 1838, even 1853 (last night's initial fall and today's HOD open), then today's daily would be a deep anchored needle - ST or IT selling dry out? Will see.
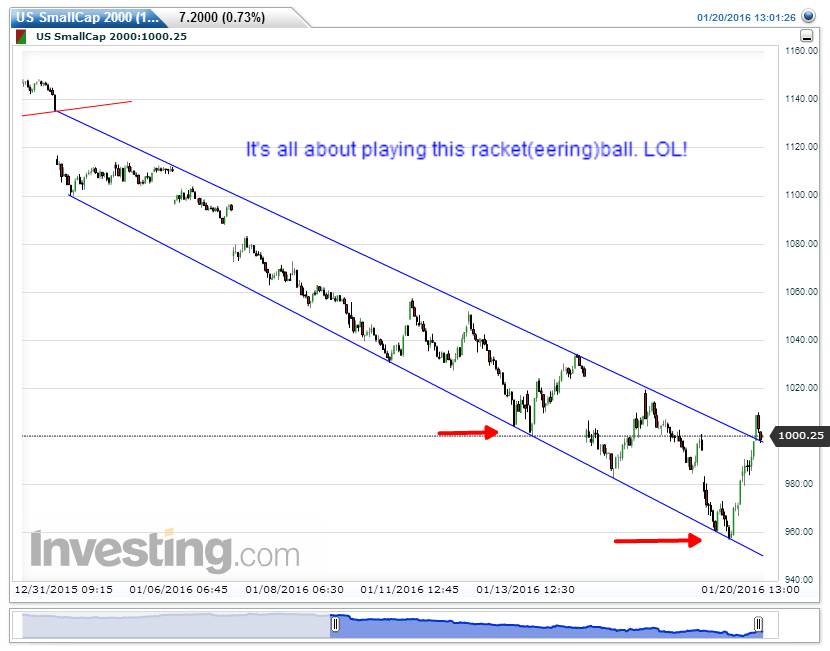
Is it all about matching the RUT racketball game? rinse and repeat shooting for 1000? BO above 1000 then 'this time is DIFFERENT since new year'.
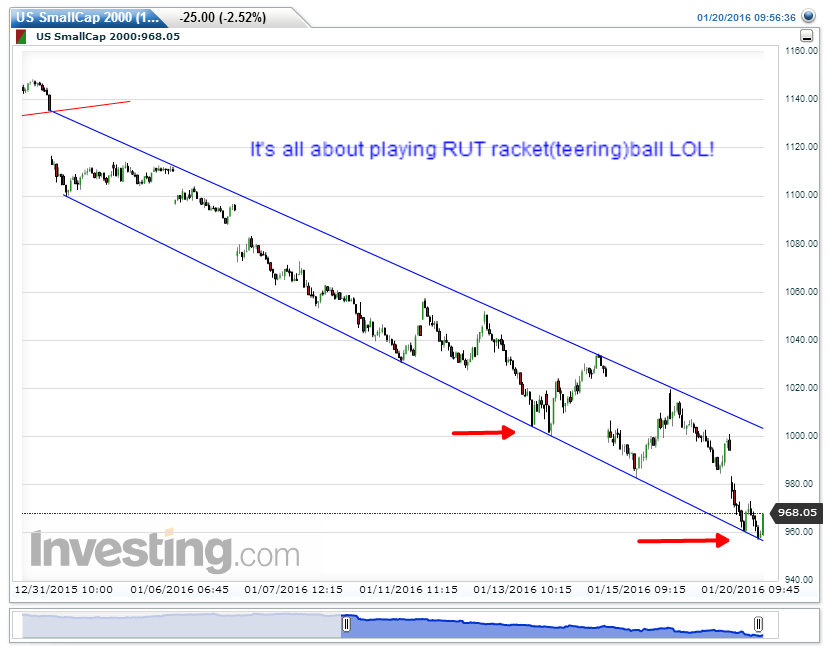
...because I also picked up this the same time RUT hit the floor?
iloli = I'm Laws Of Line's I(eye)
Posted 20 January 2016 - 06:33 PM
Is it all about matching the RUT racketball game? rinse and repeat shooting for 1000? BO above 1000 then 'this time is DIFFERENT since new year'.
Closed and backtesting TL, after BO of 1000.
iloli = I'm Laws Of Line's I(eye)
Posted 20 January 2016 - 06:43 PM
On EOD, not intraday, to close above 1838, even 1853 (last night's initial fall and today's HOD open), then today's daily would be a deep anchored needle - ST or IT selling dry out? Will see.
Closed above 1838 and 1853. Gained 60 from the "SQueeeZZa" V bottom.
iloli = I'm Laws Of Line's I(eye)
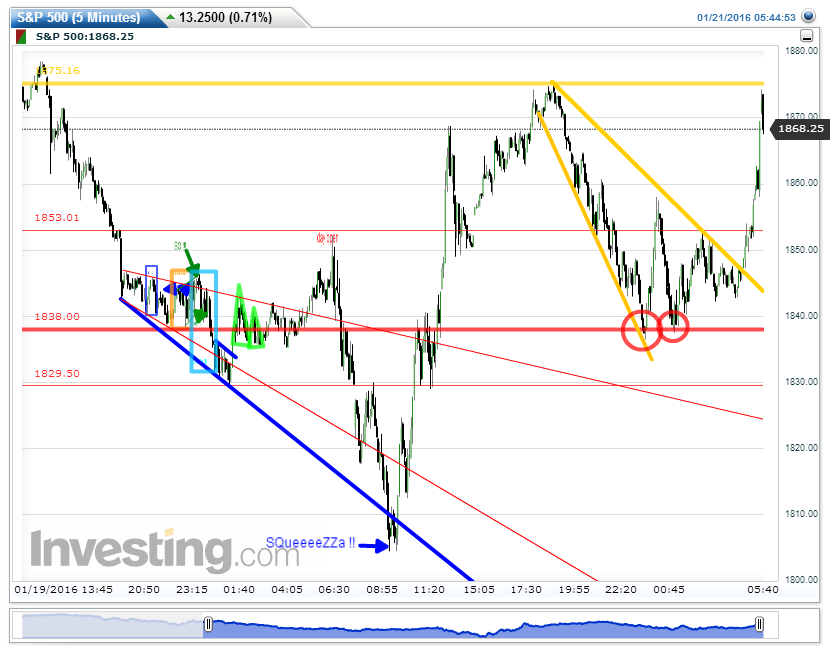
Posted 21 January 2016 - 07:42 AM
Over night so far 1838 has gotten TWO (circled) successful back tests. Yellow broadening wedge when BO, targeting back to HOD and likely continue moving upward after target hit. Of course RH market can resume sell-the-spike recent routine again, that's inertia, a judgmental wishful thinking but not chart reading. Pure TA chart reading from LOL influenced by NO noise whatsoever!
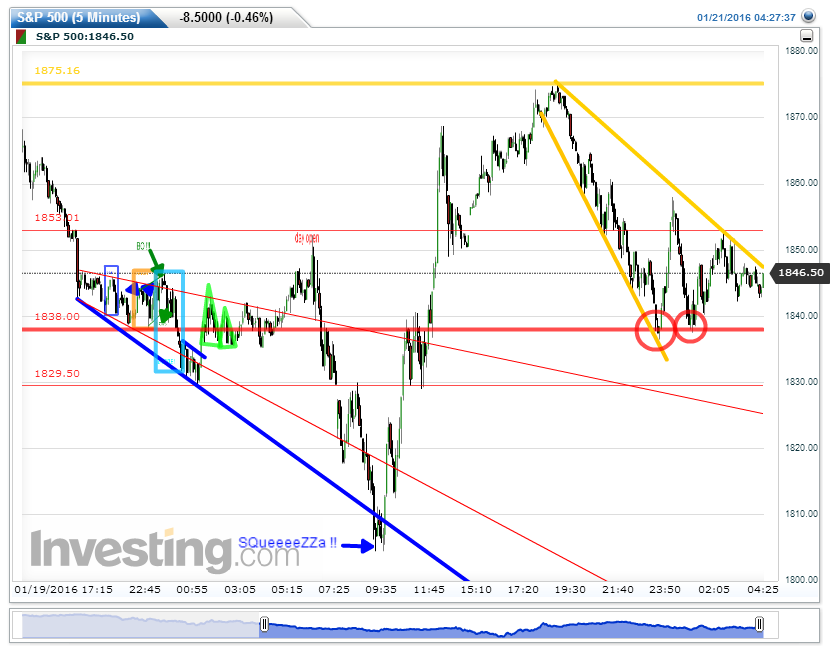
Edited by iloliway, 21 January 2016 - 07:48 AM.
iloli = I'm Laws Of Line's I(eye)
Posted 21 January 2016 - 08:13 AM
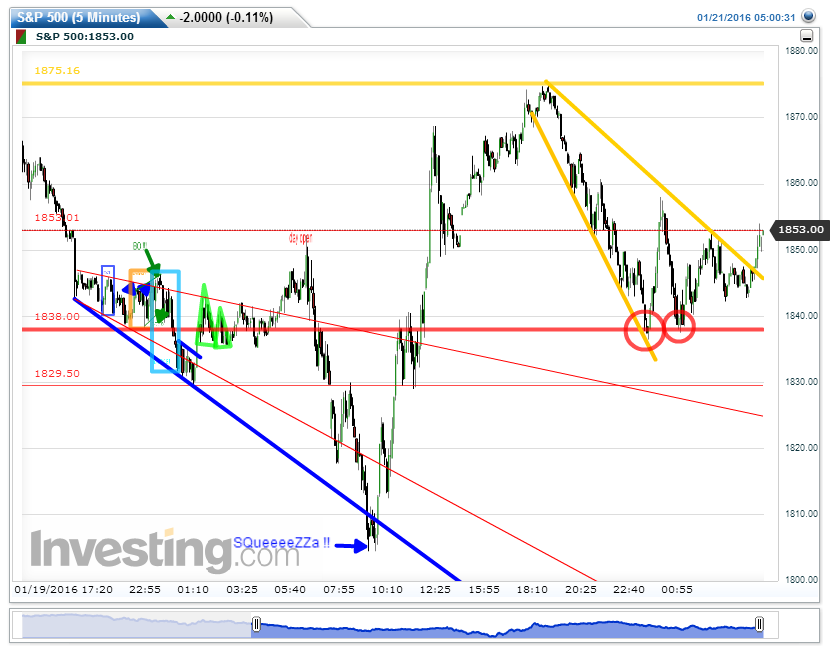
So minutes later Yellow wedge got BO. I can't predict, only read based on the pattern is a high percentage 'bullish' pattern doing its own thing.
Look how 1853 is doing its own thing pare down the advance right now...
iloli = I'm Laws Of Line's I(eye)
Posted 21 January 2016 - 08:24 AM
Talking about 1853, I gave the reason why picked it yesterday, now please move your eyes from slowly from left to right on that first thin red horizontal line. Do you see these 'price point' : initial drop, peaking top, gap creek, another peak top and the current curtailing (oops, just checked live chart it BO above to 1860 now, lol).
iloli = I'm Laws Of Line's I(eye)
Posted 21 January 2016 - 08:50 AM
See how quickly yellow target was reached and rejected !
It's only TA, each line must do its own thing.