Jump to content


Photo

ST & IT Long, bulls power on, best January since 1987


  • Please log in to reply
21 replies to this topic

#11 dTraderB

dTraderB

    Member

  • Traders-Talk User
  • 17,176 posts

Posted 01 February 2019 - 06:52 AM

WHY? Why the 180 degree turn? What has suddenly gone bad?


Charlie BilelloVerified account @charliebilello
FollowFollow @charliebilello
More

In December 2018 the Fed projected 3 more 25 bps hikes by the end of 2020. The market is currently expecting a 25 bps cut over that same time period, a difference of 1% in Dec 2020 Fed Funds Rate.

DyRqgSEXcAQaGVz.jpg
3:22 PM - 31 Jan 2019


#12 dTraderB

dTraderB

    Member

  • Traders-Talk User
  • 17,176 posts

Posted 01 February 2019 - 06:57 AM

50%?   

I think it is more like 20 to 25%


Lance Roberts @LanceRoberts
FollowFollow @LanceRoberts
More

"Why Another 50% Correction Is Possible." - THE INTERVIEW. I recently sat down with @chrismartenson to discuss why another bear market is not only possible but probable. I have attached all the relevant charts to the interview. $SPY $TLT https://realinvestmentadvice.com/the-interview-why-another-50-correction-is-possible/ 

DyUTvATVYAA6bnr.jpg
3:40 AM - 1 Feb 2019


#13 dTraderB

dTraderB

    Member

  • Traders-Talk User
  • 17,176 posts

Posted 01 February 2019 - 06:58 AM

OK, today should be UP, based on this:


Bespoke @bespokeinvest
FollowFollow @bespokeinvest
More

Since the Financial Crisis lows, the first trading day that follows a monthly gain of over 5% has been extremely positive. https://www.bespokepremium.com/think-big-blog/5-months/ 

DyREf-oW0AAHlCW.jpg
12:35 PM - 31 Jan 2019


#14 dTraderB

dTraderB

    Member

  • Traders-Talk User
  • 17,176 posts

Posted 01 February 2019 - 07:01 AM

Not a fan of overbought or oversold, markets can remain in these conditions for days & weeks & months


Stocks Have Been This Overbought Before…Once
January 31, 2019   0 

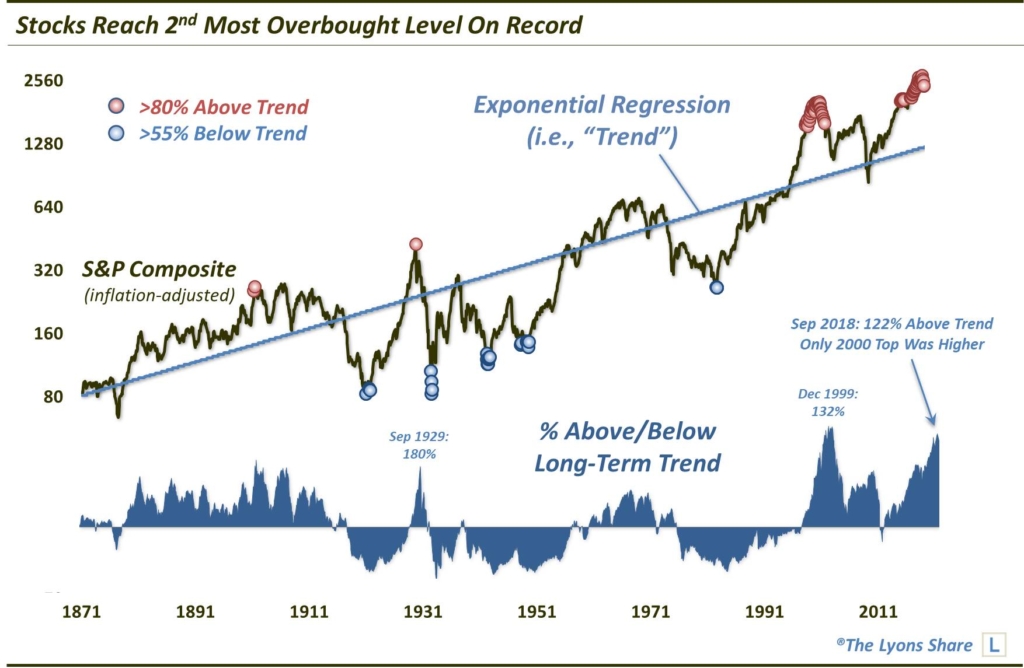
U.S. stocks recently registered the 2nd most overbought condition In their 150-year history.

Temperatures wrought by the polar vortex here in Chicago have truly reached ludicrous levels. Today’s low is projected to be minus 26 degrees Fahrenheit — without the wind chill. That got me thinking — is that the coldest temperature ever recorded in the city? After 20 seconds of digging, I discovered that it was not the record. It has actually been colder here before — ONCE. 34 years ago, on January 20, 1985, temperatures reached a record cold reading of minus 27.

That near record had me thinking about the stock market — specifically, the degree to which stocks, on a long-term basis, are stretched, or “overbought”. Yes, the recent correction relieved much of the prevailing shorter-term overbought condition. But on a long-term basis, it has hardly made a dent. That’s because, coming into the correction the stock market may not have been at the most overbought condition of all-time — but it was at the 2nd most overbought of all-time.

How did we determine that? We are using the inflation-adjusted S&P Composite data available from Robert Shiller’s site. This composite is essentially the current S&P 500 with re-engineered pricing prior to its inception in the 1950’s with available stock prices from the time. We then used exponential regression smoothing to find the “best fit” trend line on the series since 1871 (h/t to Doug Short for the concept.)

After finding the best fit trend line for the composite, we can measure how far above or below prices are at a given time. As it turns out, this past September saw the composite reach 122% above the trend line, i.e., it was 122% “overbought”. In nearly 150 years, the only months that saw prices more overbought than that were those encompassing the 1999-2000 market top — the most excessive, bubbly top in U.S. market history.

Stocks-Vs-Long-Term-Trend-Jan-2019-1024x

So what does it mean? We aren’t going to go into a long essay on its implications. We posted an excerpt the other day from our 1st Quarter Client Letter about the longer-term risk embedded in the market. Suffice it to say, the stock market is extended. Can it stay extended? The past few years prove that it can.

However, we will emphasize that it is likely not the best time to commit a lot of long-term capital to the U.S. stock market. Sure, the market remained stretched to these levels for more than a year during the 2000 top. So it is possible that the market continues higher unimpeded. However, looking historically, that period was an anomaly. If you are willing to bet on it happening again, go for it. If not, you may consider adopting measures, or managers, to aid in managing risk.


#15 redfoliage2

redfoliage2

    Member

  • Traders-Talk User
  • 18,000 posts

Posted 01 February 2019 - 08:38 AM

US big banks will be a big beneficiary from the trade talk if a deal is reached as China proposed to open more market shares for US financial institutions.  I'm bullish on big US banks.


Edited by redfoliage2, 01 February 2019 - 08:44 AM.


#16 redfoliage2

redfoliage2

    Member

  • Traders-Talk User
  • 18,000 posts

Posted 01 February 2019 - 09:53 AM

Bulls must hold SPX 2700 line today to pave the way to test the 200 dma around 2740..................


Edited by redfoliage2, 01 February 2019 - 10:02 AM.


#17 da_cheif

da_cheif

    Member

  • Traders-Talk User
  • 10,960 posts

Posted 01 February 2019 - 11:58 AM


VXXB below 33 will stir my interest in going LONG (short SPX); it is now trading with a 35 handle


Charlie Bilello

Verified account @charliebilello
FollowFollow @charliebilello
More

The Volatility Index closed just above its 200-day moving avg today, lowest level since Dec 3. Has not closed below 200-day since Oct 5. $VIX

DyST4oWW0AIRo0Z.jpg
6:23 PM - 31 Jan 2019


#18 dTraderB

dTraderB

    Member

  • Traders-Talk User
  • 17,176 posts

Posted 01 February 2019 - 12:33 PM

Bulls must hold SPX 2700 line today to pave the way to test the 200 dma around 2740.................


ST topping process in progress.


There could be a last hour ramp to as high as SPX 2730 but there does not seem to be the conviction to go higher, and many have good profits from January and are gradually lightening their portfolio


#19 dTraderB

dTraderB

    Member

  • Traders-Talk User
  • 17,176 posts

Posted 01 February 2019 - 12:34 PM

BULL TRAP?


Bull Trap

200w.gif?resize=148%2C80&ssl=1The bulls are back. $SPX up nearly 8% in January and nearly 14% off of the December lows. What slowing global growth? What reduced earnings expectations? Trade wars? Who cares. It’ll all sort itself out, all that matters was the Fed caving in spectacular fashion laying the foundation for the big bull case. The central bank 2 step is back: Dovish + dovish = nothing but higher prices. The lows are in, what else can I buy? This pretty much sums up current sentiment.

And so goes the familiar script during emerging bear markets, a general sense of relief that the lows are in and a return of optimism and greed after an aggressive counter rally following an initial scary drop. Long forgotten are the December lows after a torrent consecutive 6 weeks of higher prices.

While indeed a renewed fully dovish Fed may be all that’s needed to keep 2019 bullish (after all this playbook has worked for the past 10 years) there is evidence that this rally may turn out to be a big fat bull trap.

And it’s not a single data point, but rather it’s a confluent set of factors that are acting in concert that give credence to this possibility.

Let me walk you through the factors step by step.

Firstly here’s the big monthly chart of everything as I call it which includes $SPX, some basic technical elements, but also a price chart of the 10 year yield ($TNX) and the unemployment rate:

SPXM.png?resize=639%2C692&ssl=1

Note the common and concurrent elements of the previous two big market tops (2000 & 2007) versus now:

  1. New market highs tagging the upper monthly Bollinger band on a monthly negative RSI (relative strength) divergence – check


  2. A steep correction off the highs that breaks a multi-year trend line – check

  3. A turning of the monthly MACD toward south and the histogram to negative – check

  4. A correction that transverses all the way from the upper monthly Bollinger band to the lower monthly Bollinger band before bouncing – check

  5. A counter rally that moves all the way from the lower Bollinger Band to the middle Bollinger band, the 20MA – check

  6. A counter rally that produces a bump in the RSI around the middle zone alleviating oversold conditions – check

  7. All these events occurring following an extended trend of lower unemployment, signaling the coming end of a business cycle – check

  8. All these events coinciding with a reversal in yields – check

  9. All these events coinciding with a Federal Reserve suddenly halting its rate hike cycle – check

I submit that the current counter rally is consistent with all of these factors. Indeed, as with counter rallies in the past, this rally remains below its broken trend line.

What can we learn from the counter rallies during the two previous emerging bear markets?

In 2008, following the 2007 top, $SPX fell deep below its 200MA, but then saw an aggressive counter rally in a rising wedge pattern that stopped at the 200MA before everything reversed:

2008.png?resize=639%2C282&ssl=1

What did optimistic, the coast is clear, buyers know then? Nothing as $SPX didn’t bottom until 666 in March 2009.

In 2001 $SPX rallied hard from a yearly low in December (similar to now) and the high was made on January 31, the last trading day of the month. Unbeknownst to buyers then that day turned out to be the high for YEARS to come as markets turned south in advance of the coming recession:

continued here:

https://northmantrad...2/01/bull-trap/


#20 dTraderB

dTraderB

    Member

  • Traders-Talk User
  • 17,176 posts

Posted 01 February 2019 - 12:43 PM

Weekend here, almost, but I haven't started hitting the bottle..... so why do I think there is something not right here:


1) Best January for Stocks in over 30 years.

2) Jobs up for the 100th consecutive month, longest run in history (by 2x).

3) Wages up 3.2% YoY, highest growth of expansion.

4) Dovish Fed - market saying next move will be a rate cut.


US Hourly Earnings up 3.2% in the past year, largest increase of the expansion. Wage growth has outpaced core inflation (YoY) for 74 consecutive months. #payrolls

DyUxSdoW0AE7U_U.jpg
5:49 AM - 1 Feb 2019

S&P 500: With 58% of companies reported, GAAP EPS up 31% YoY. Highest earnings growth in 8 years. $SPX

DyVWiPxWsAImllj.jpg
8:32 AM - 1 Feb 2019
Most inverted US Yield Curve since August 2007. 1-yr treasury yield 4 bps higher than 7-yr yield...
DyUzYmOWwAETlpx.jpg
5:58 AM - 1 Feb 2019