After starting out on Monday falling off the proverbial cliff, the equity markets were able to catch a branch on the way down, and then struggled their way back up to safety for the rest of the week as the major market indexes finished on Friday with a small weekly average gain of +.12%, with the Dow Industrials showing the best recovery effort as it finished higher by +1.34%.
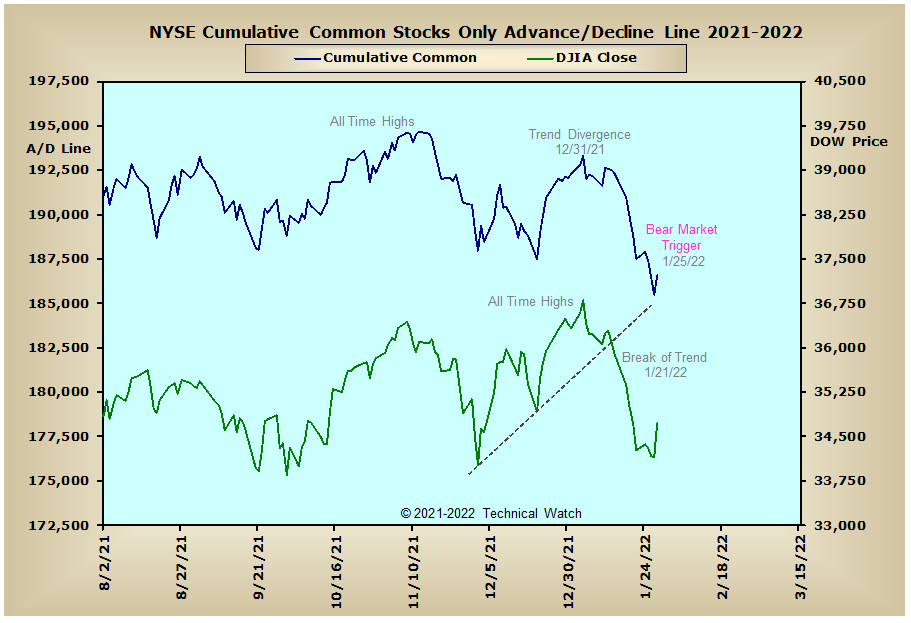
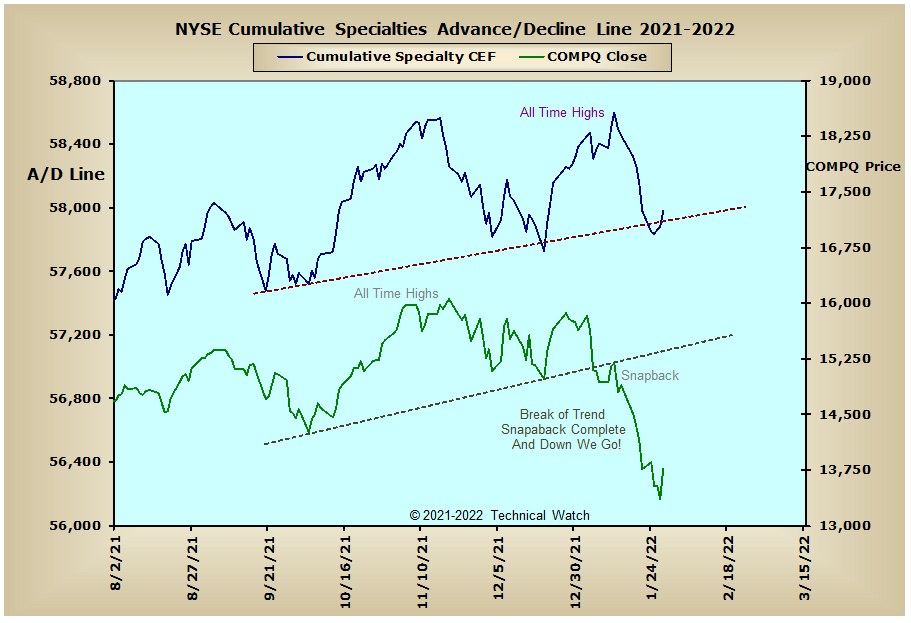
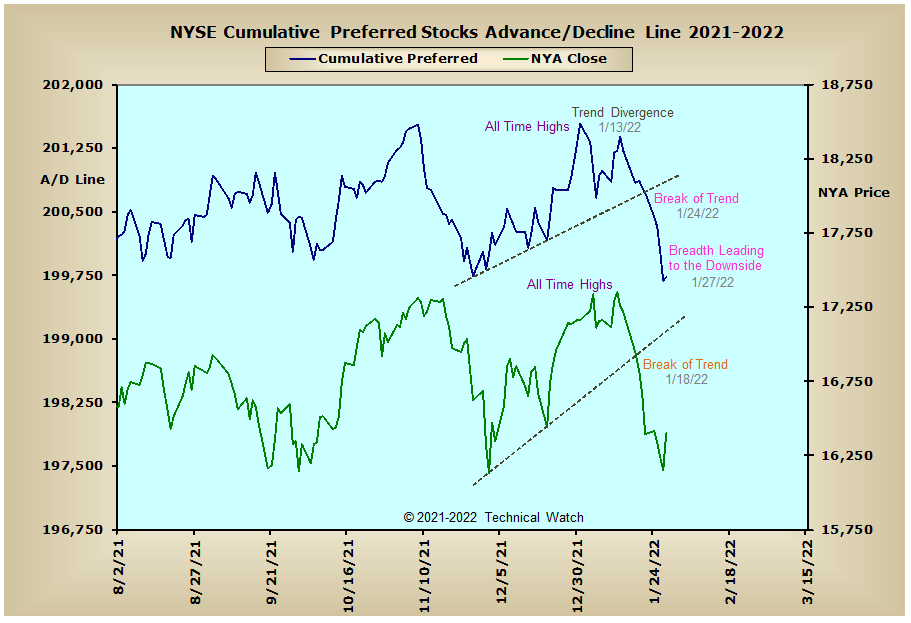
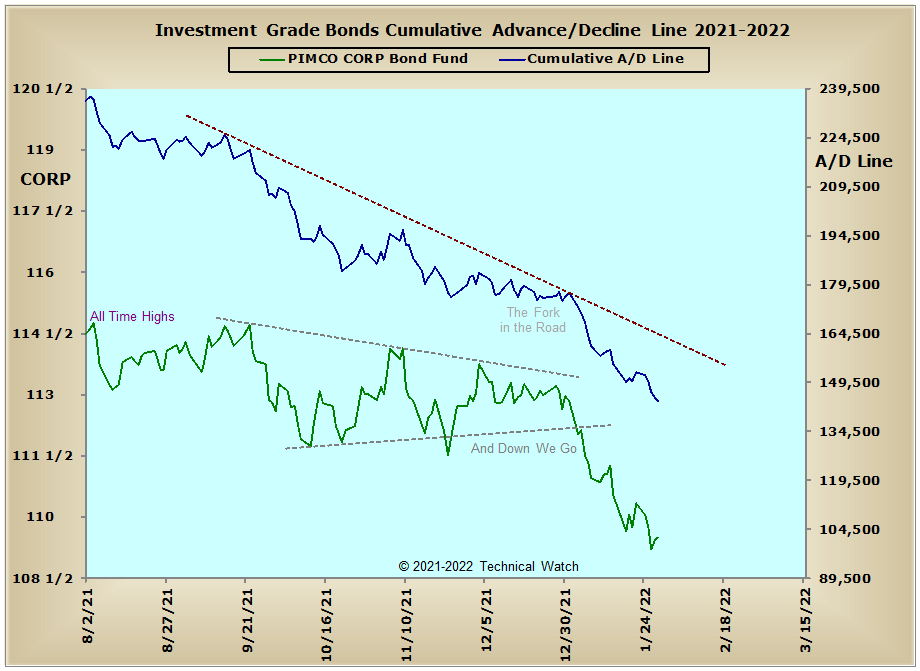
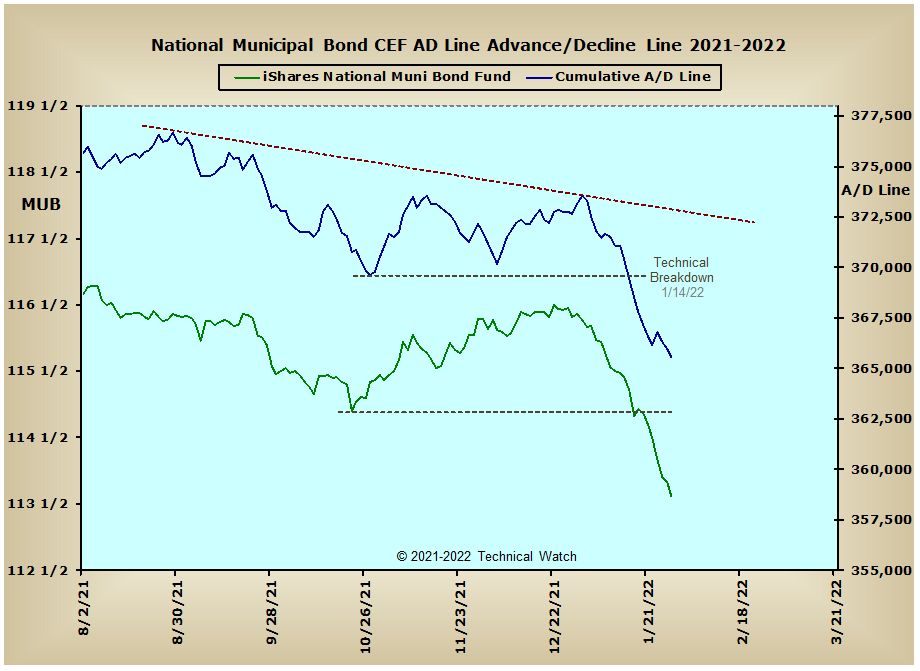
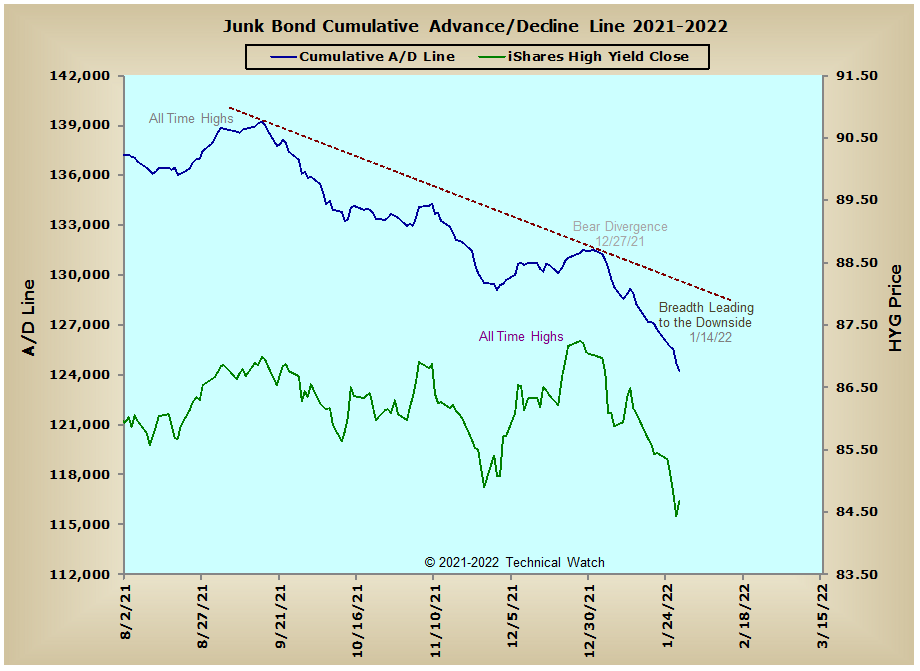
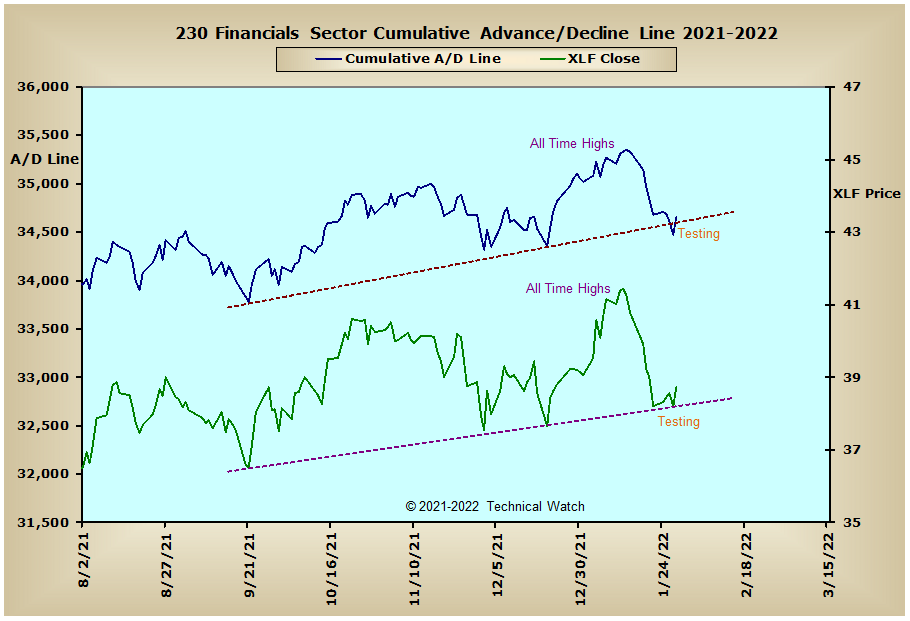
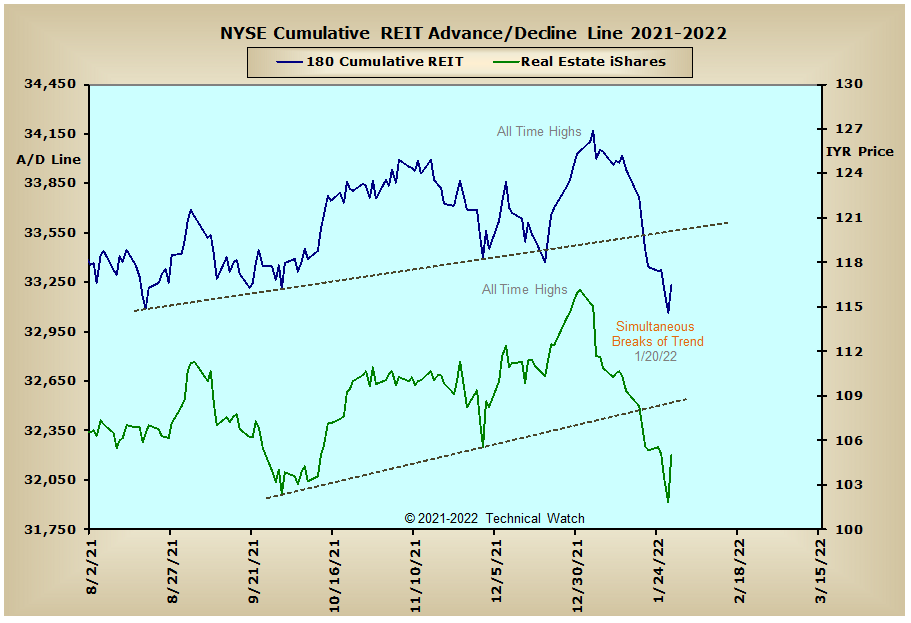
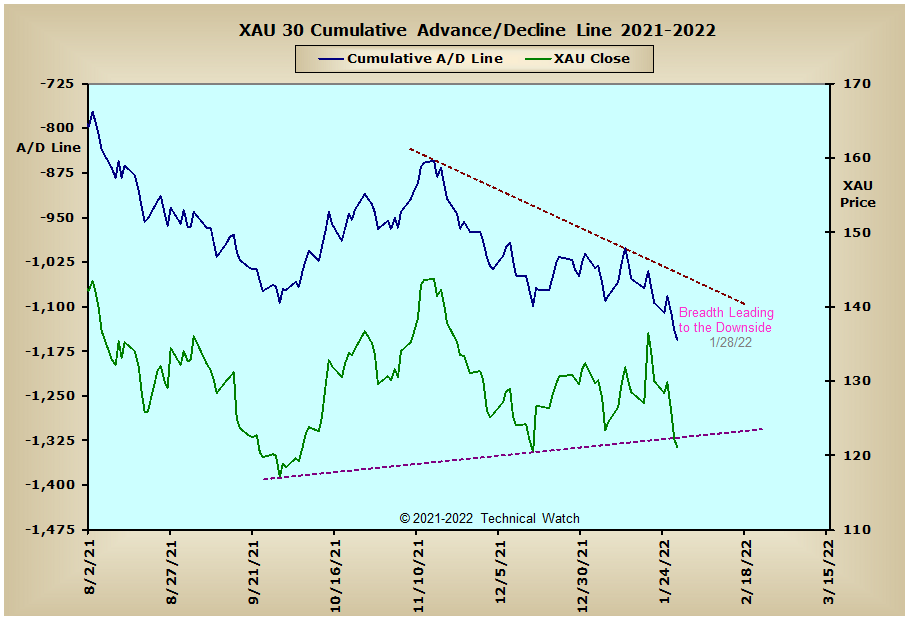
Looking over this week's usual array of cumulative breadth charts shows that the NYSE Common Only advance/decline line joined the broader based NYSE Composite advance/decline line in triggering its "Trend Divergence" structure on Tuesday putting the entire NYSE into a technical bear market configuration. Selling also picked up in the NYSE Preferred Stock advance/decline line as well and is now leading prices, overall, to the downside. After the previous week's SOB trigger, the Russell "2051" advance/decline line reached its initial downside targets of equality both in breadth and price on Thursday before Friday's reflex bounce. The interest rate sensitive issues continue to be under immense downside pressure at this time as all finished at or just above their lows of the week. The expectation of higher interest rates continues to keep the selling pressure on in the precious metals complex as breadth is now leading price to the downside in both the price of gold and the XAU index. While the Financials Sector advance/decline line and XLF continue to test their longer term rising bottoms lines, the Energy Sector advance/decline line continues to show bearish divergences between it and prices in the XLE. Putting our Elliott Wave cap on for a moment, and we also see that we have the possibility of a completed 5 wave structure with this same divergence. This would then suggest that this sector has or is now topping out, and that lower prices will be seen with energy related issues as we move into the month of February. Meanwhile, with the exception of the earth commodity heavy Aussie advance/decline line, the other international markets continue to defy the bearish implications facing equities here in the United States. Whether this is a potential of better things to come, or that these markets will eventually have to play catch up, is still yet to be determined.
So with the BETS holding steady at -35, the market environment remains hostile at this time. Although we have new flag lows in several of the breadth and volume McClellan Oscillators, there are still others that showed bullish divergences late in the week that finally provided traders with a relief rally on Friday. Given that we still don't have a unanimous wash out at this time, we should expect further negative price action for much of the month of February. All of the McClellan Summation Indexes have now moved down and through their respective zero lines with the exception of the OEX breadth and volume and Dow breadth MCSUM's. With all three of these MCSUM's now within range of joining the others in negative territory, the odds are high that another hard sell off will be felt as intermediate term control of prices moves unanimously from a positive to negative opinion. Both the NYSE (.91) and NASDAQ (.87) Open 10 TRIN's are neutral as we start the week ahead, while put/call ratios continue to improve for the bullish case as both the CBOE and Equities 10 day averages are now at their highest levels since the March 2020 crash. Put option implied volatility remains a bit on the high side, but not nearly so to be called a panic. Sentiment, as measured by Wall Street Sentiment, was heavily on bull side at 64%, with only 14% having a bearish opinion. Given the struggles breadth of market had mid week after Monday's recovery, along with mixed data we're getting at this time, the week ahead will likely be on the soft side as go into Friday's jobs numbers here in the United States. With all this in mind then, let's continue to explore this new bearish path of least resistance for the week ahead, while keeping a peripheral eye on how things are going in the international bourses.
Have a great trading week!
US Equity Markets: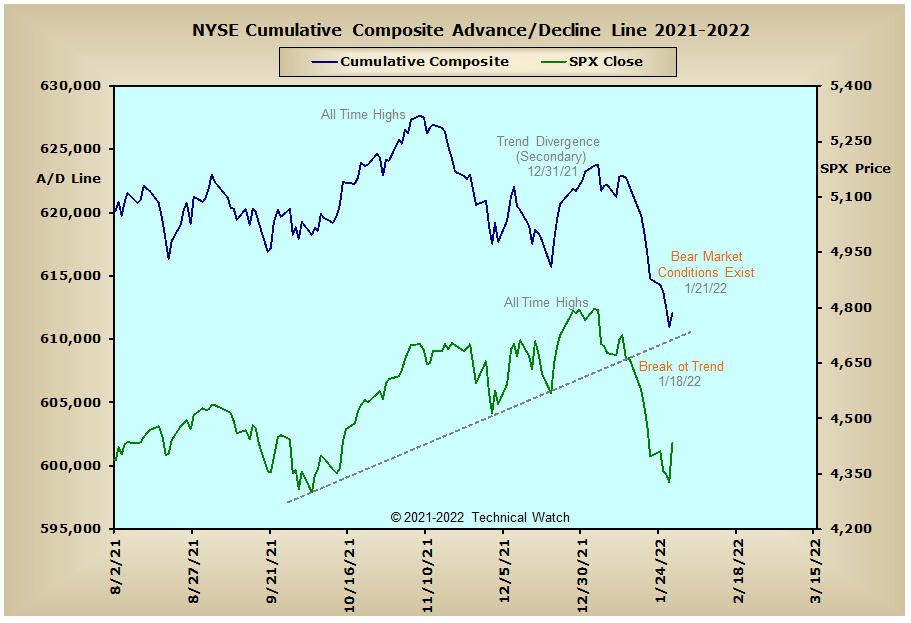

US Interest Rates: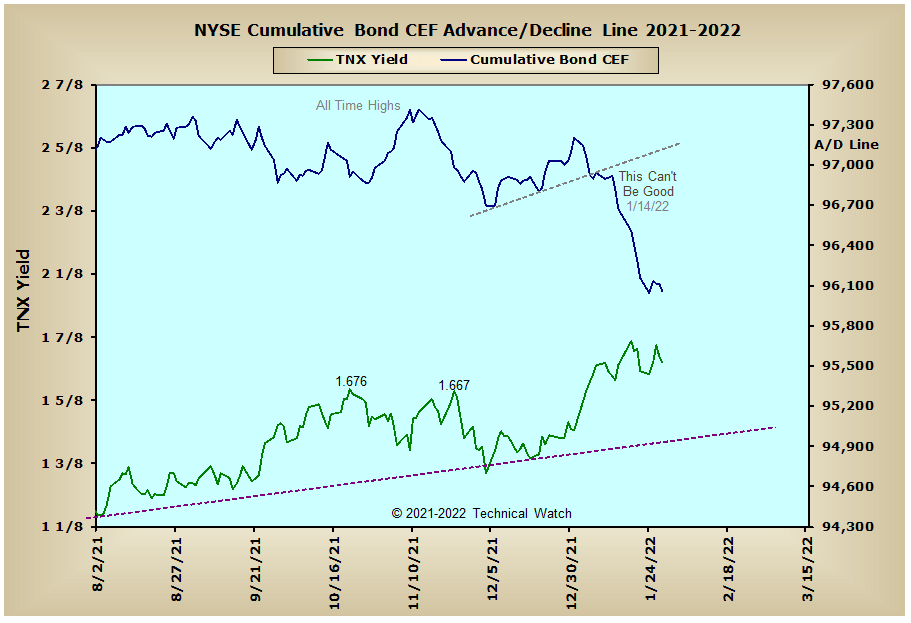
US Sectors: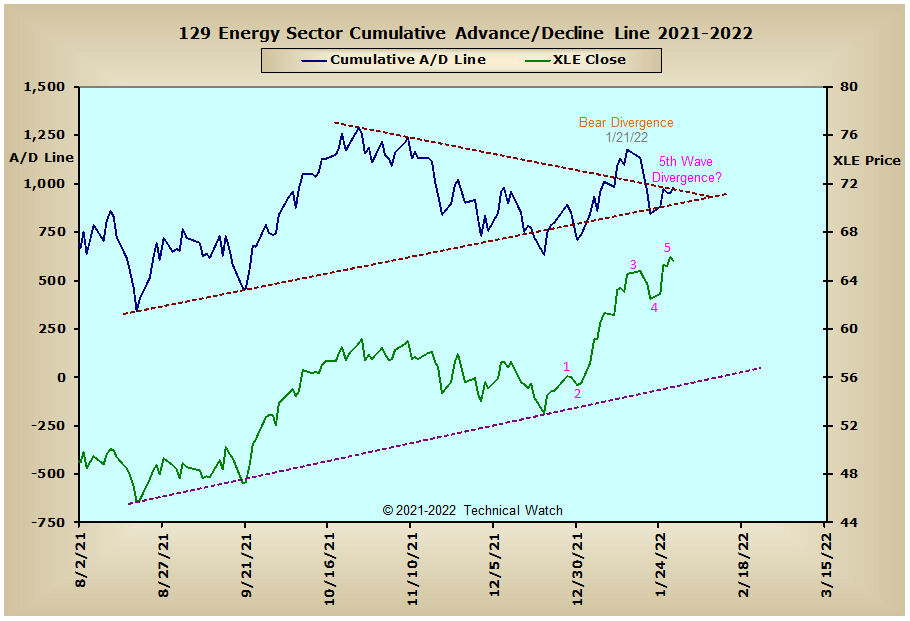
Precious Metals: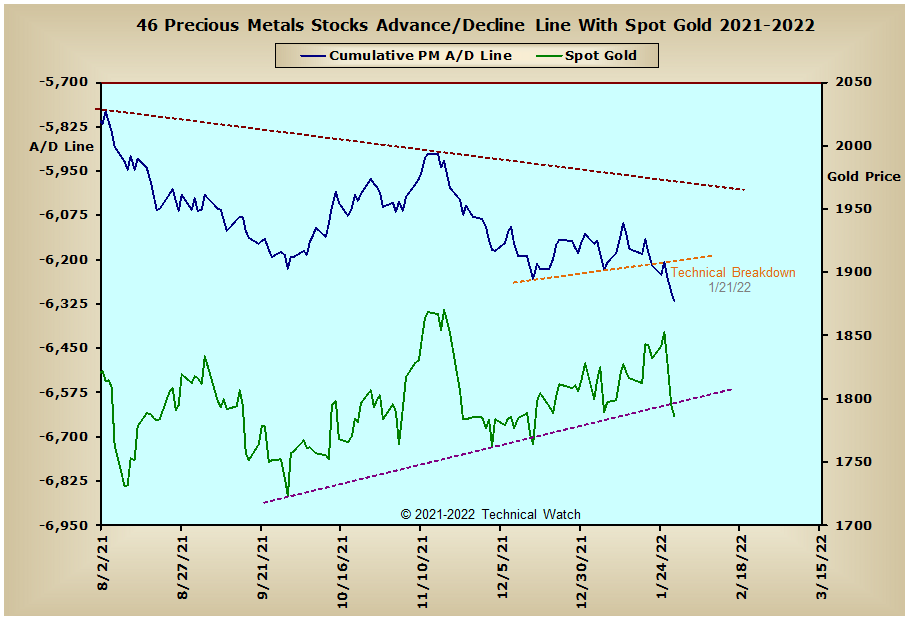
Australia:
England: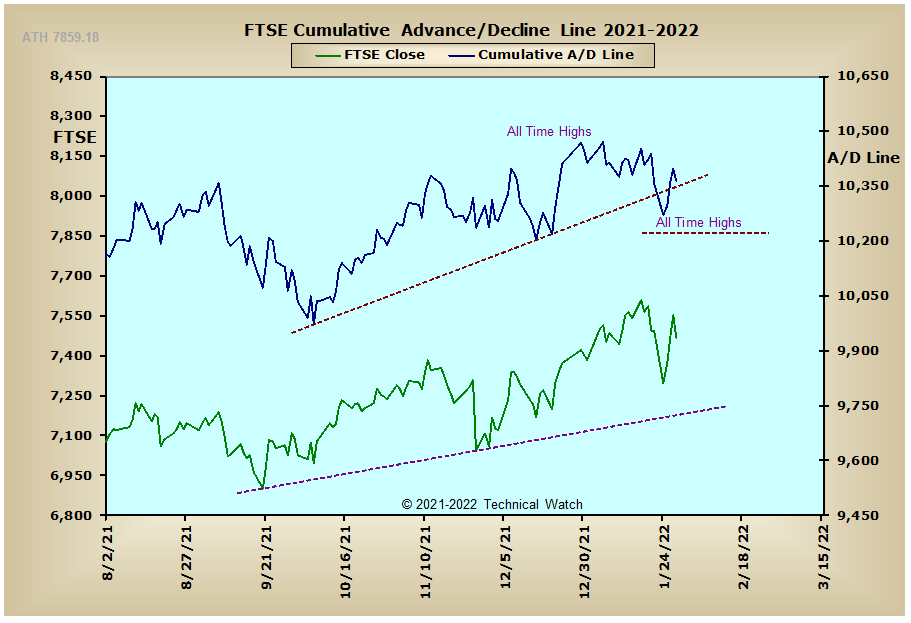
France: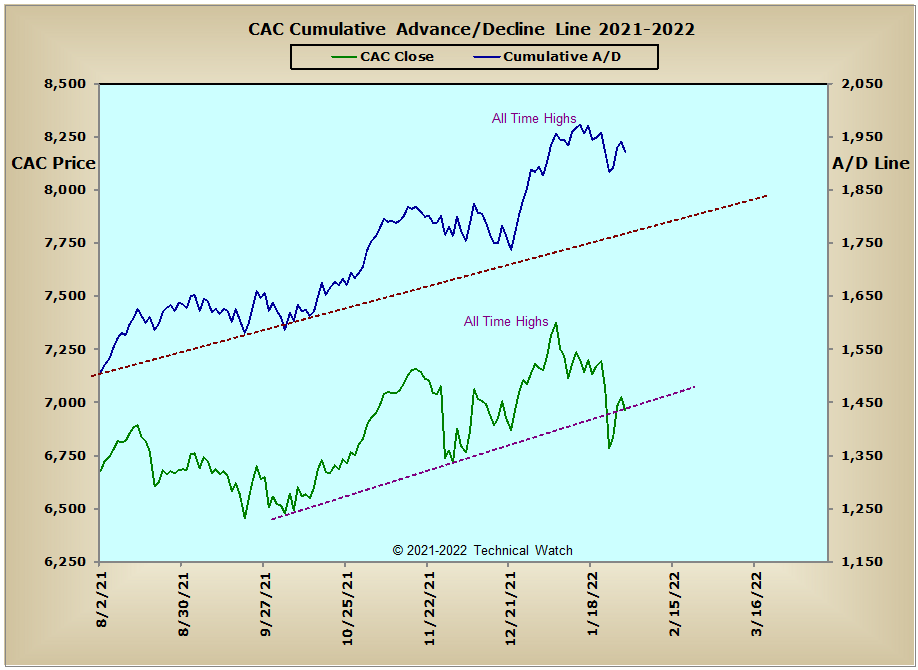
Germany: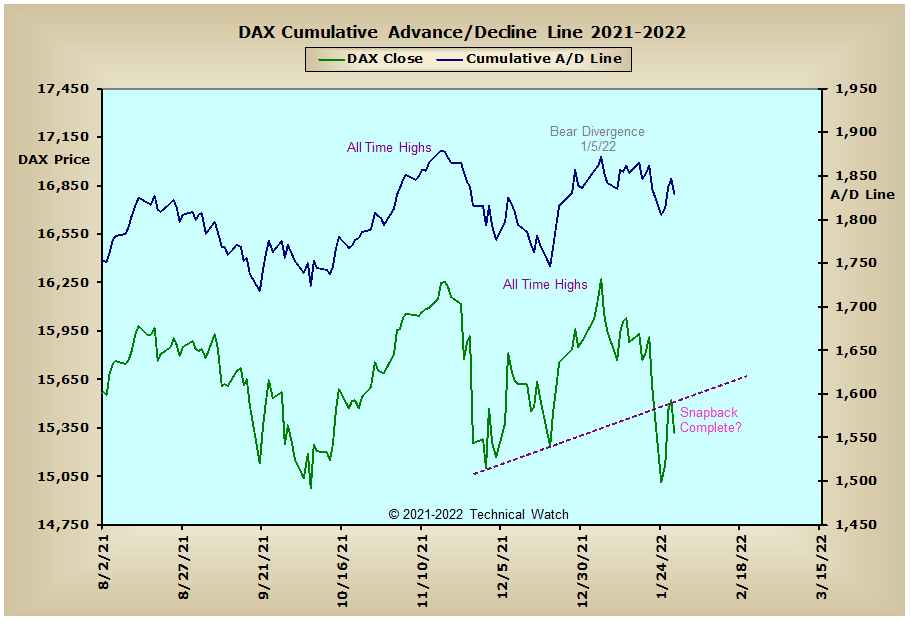
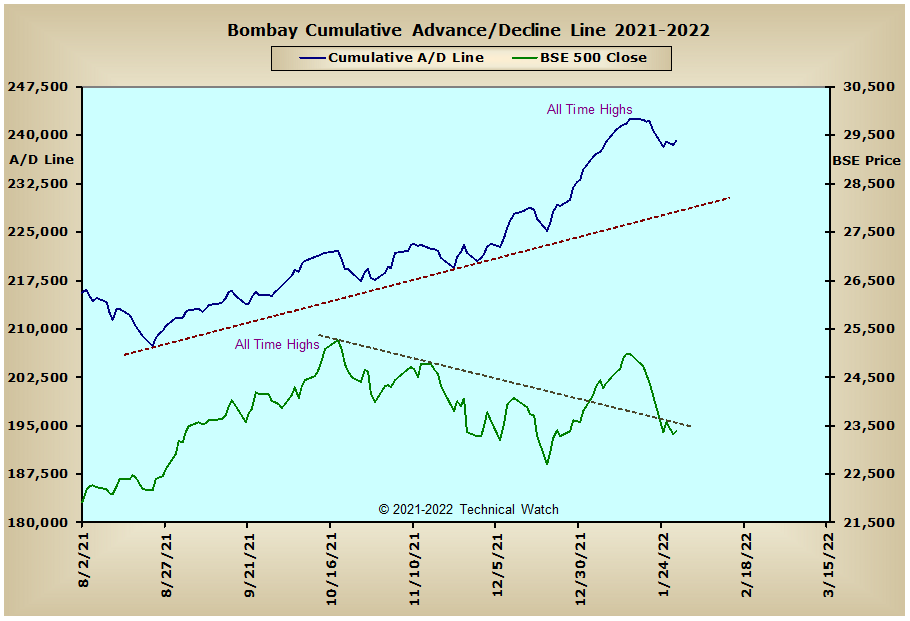
India: