
After drifting lower to begin the holiday shortened week, stock market prices found a foothold on Thursday and then rallied higher on Friday to finish the week with an average gain of +.70%, with the NASDAQ Composite Index leading the advance as it added +1.70%. It was also a historical week as well as the S&P 500 joined the Dow Industrials, Major Market, S&P 100 and NASDAQ 100 Indexes (with the help of an all time high close in the SOX (semiconductor) index) in also finishing at a new all time closing high.
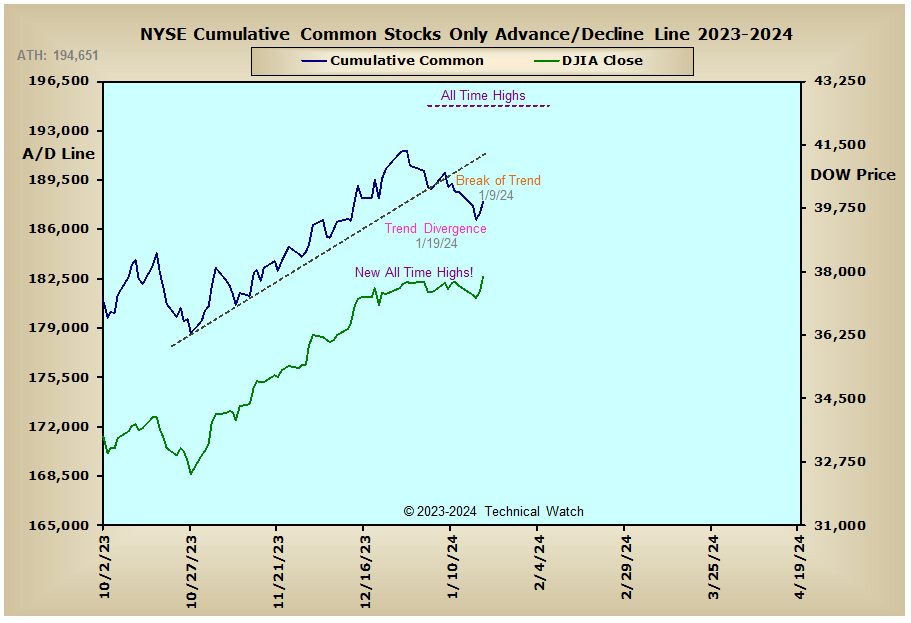
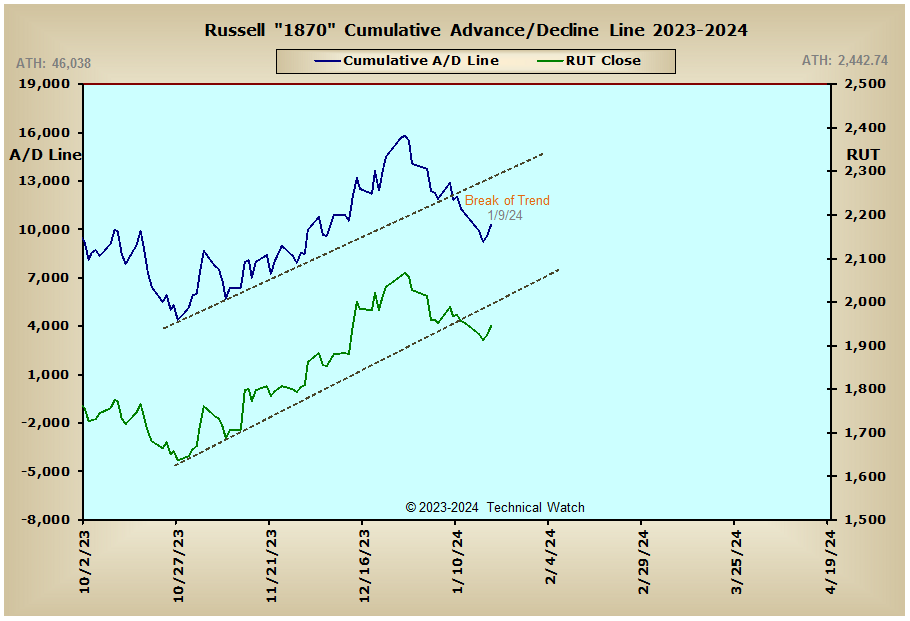
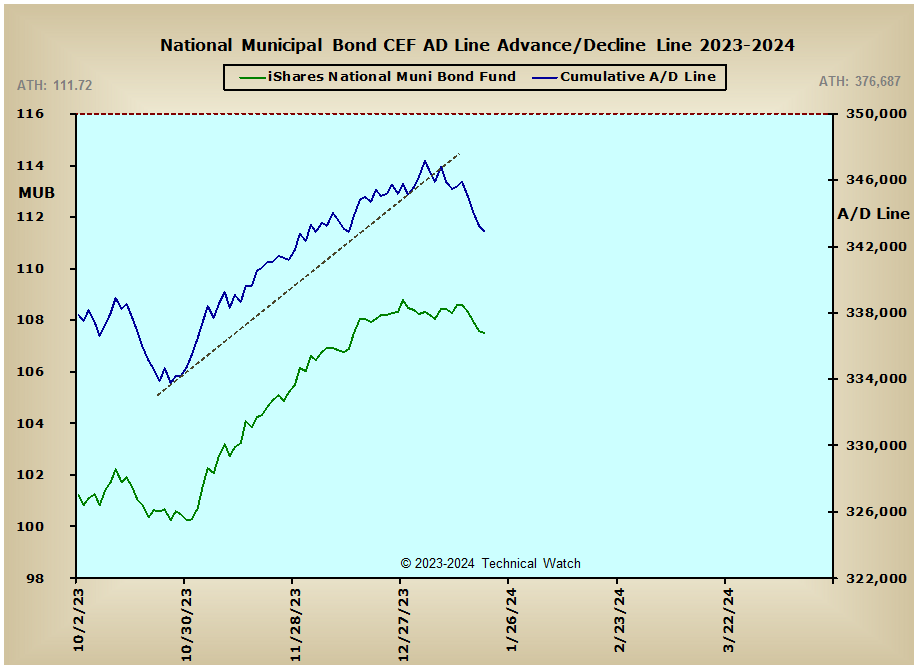
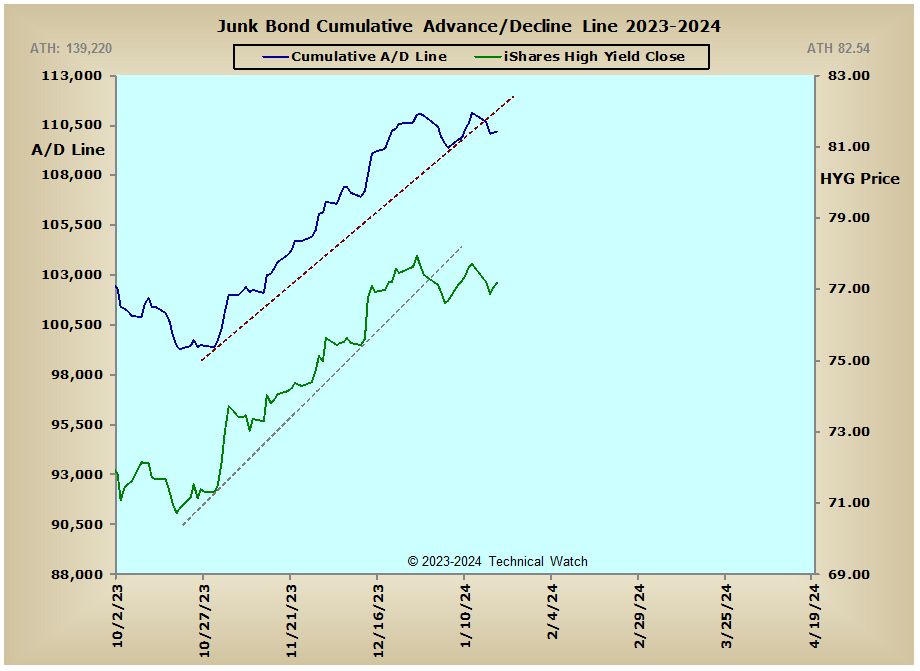
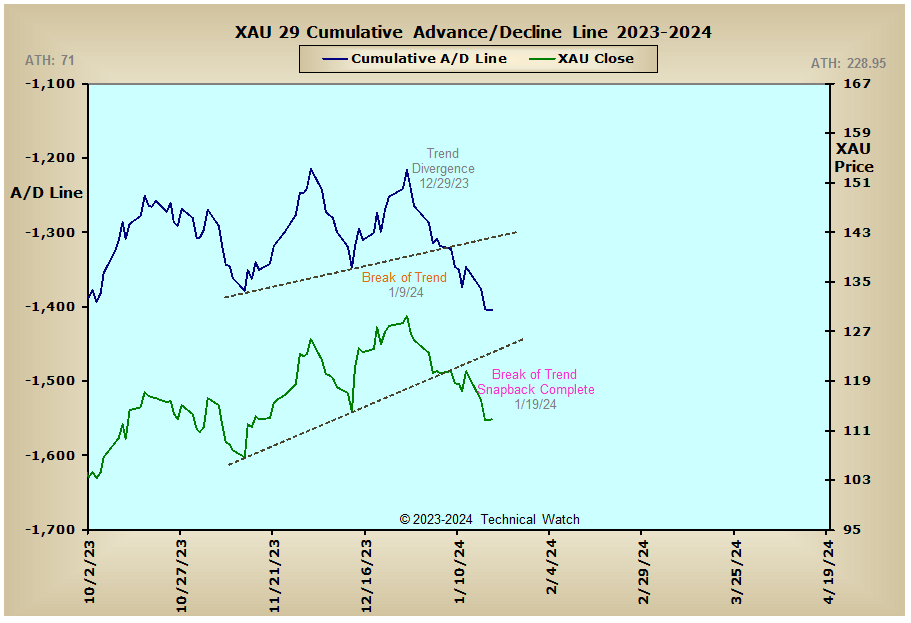
Taking a look at this week's standard array of cumulative breadth charts shows that breadth participation in the NYSE Composite and NYSE Common Only advance/decline lines are lagging that of the new all time price highs seen in the Dow and SPX and this has created our first "trend divergence" condition. If this non confirmation between breadth and price persists as it did back in December of 2021, this would suggest that we are in the final stages of the current advancing price structure that began back in the early days of November. Interest rate sensitive issues continue to have an indecisive tone to them, but if the FedWatch tool is any indication of how traders are thinking, the direction of rates should continue to have a lower bias from the March meeting moving forward. The higher rates of the last several weeks continues to put downside pressure on the Precious Metals and XAU advance/decline lines as they maintain their short term trends to the downside, while the Energy Sector advance/decline line is also leaning toward a global economy that might not be as strong as many might have you believe. The CAC, DAX and FTSE advance/decline lines are now working with a series of tops beneath tops controlling their patterns, while Aussie advance/decline line broke its rising trendline last week that also goes back to the early November period. With the momentum move of the November/December breadth thrusts now likely underway, our focus will now turn to whether any higher price levels from here are being lifted up by fewer and fewer issues which would eventually lead to another significant topping period. Stay tuned.
So with the BETS unchanged with a reading of zero, the short term battle for control between the buyers and the sellers continues. As we start the week ahead we see that the great majority of the breadth and volume McClellan Oscillators remain well below their zero lines, and with the new price highs seen mainly in the large cap indexes and the aforementioned of signal "trend divergence" now working, this bearish vacuum created between breadth and price provides us with a highly negative warning once we get past February's OPEX event on the 16th. In most circumstances, we usually see some backing and filling with prices so that the internals can play "catch up", but with the immense bullish strength of November and December now acting as a momentum push, one has to wonder if this is some sort of final hurrah for a much longer term bull market condition. All in the fullness of time will we know for sure.
In other areas, the NYSE Open 10 TRIN remains at deeply "oversold" levels at 1.30 which will continue to make it very difficult for the sellers to maintain their efforts, while the NASDAQ Open 10 TRIN finished on Friday at a .90 neutral reading. The 10 day running average of the CBOE and Equity put/call ratios were basically at the same levels from the week before through January 18th, while put volatility premiums have become neutral again after finding resistance at the upper portion of their Bollinger Bands. Taken altogether then, and outside of the potential of price snapbacks in the large cap indexes early in the week, the current intermediate term trend continues to have an upside bias until proven otherwise. Because of this, let's continue to walk along the bullish path of least resistance for another week, but at the same time, keeping a sharp eye out for any bearish surprises that might be lurking behind the trees and bushes along this same path.
Have a great trading week!
US Equity Markets: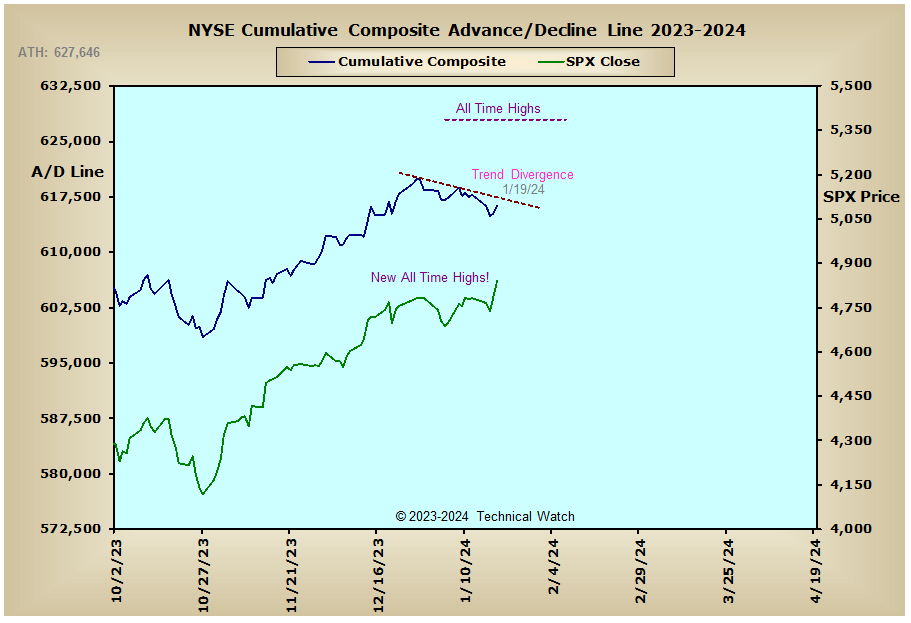
US Interest Rates: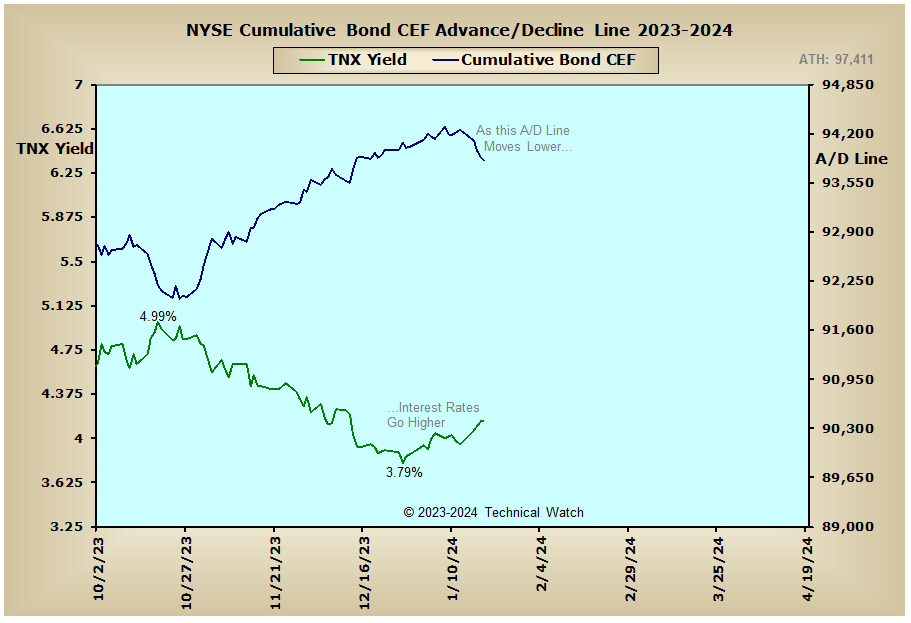

US Sectors: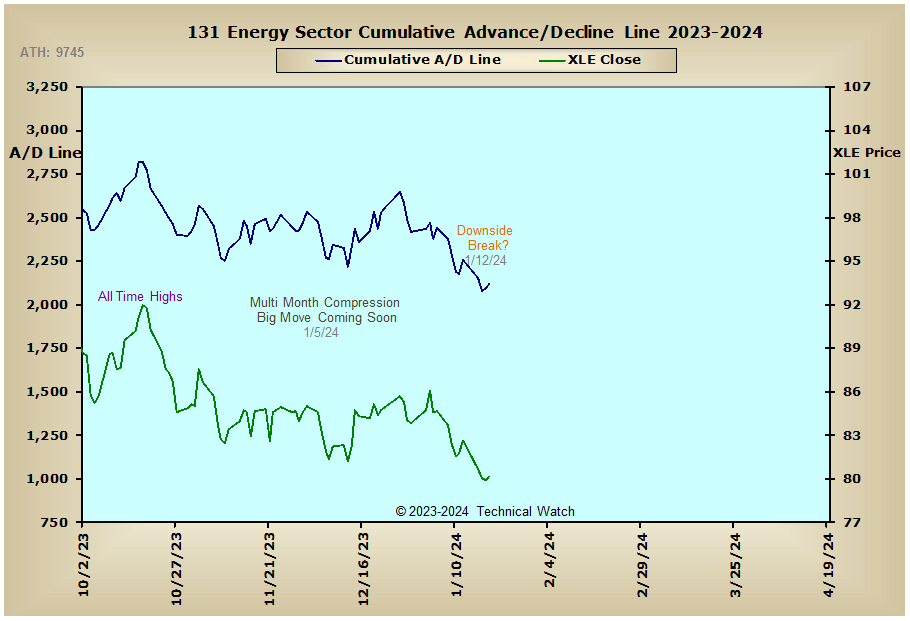
Precious Metals: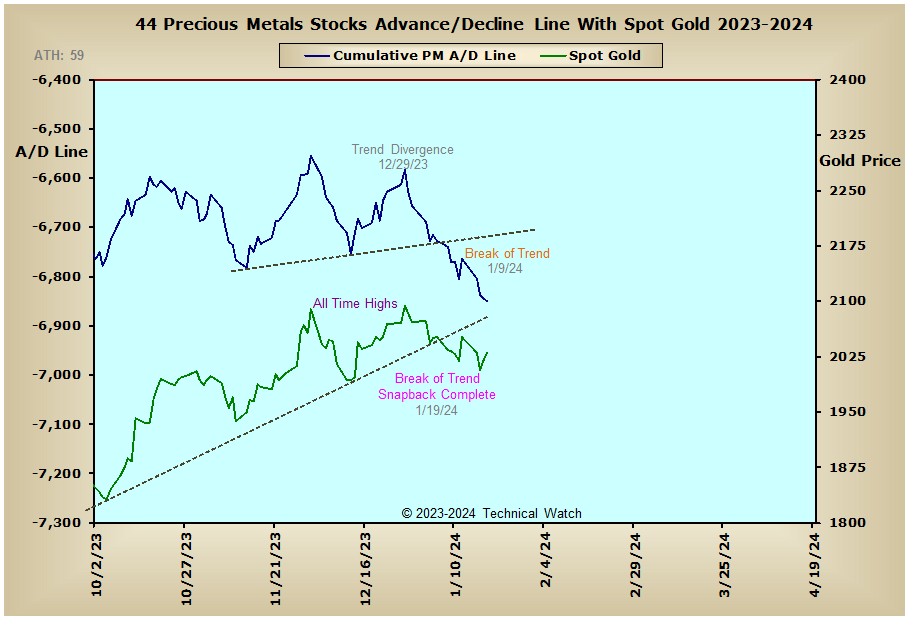
Australia: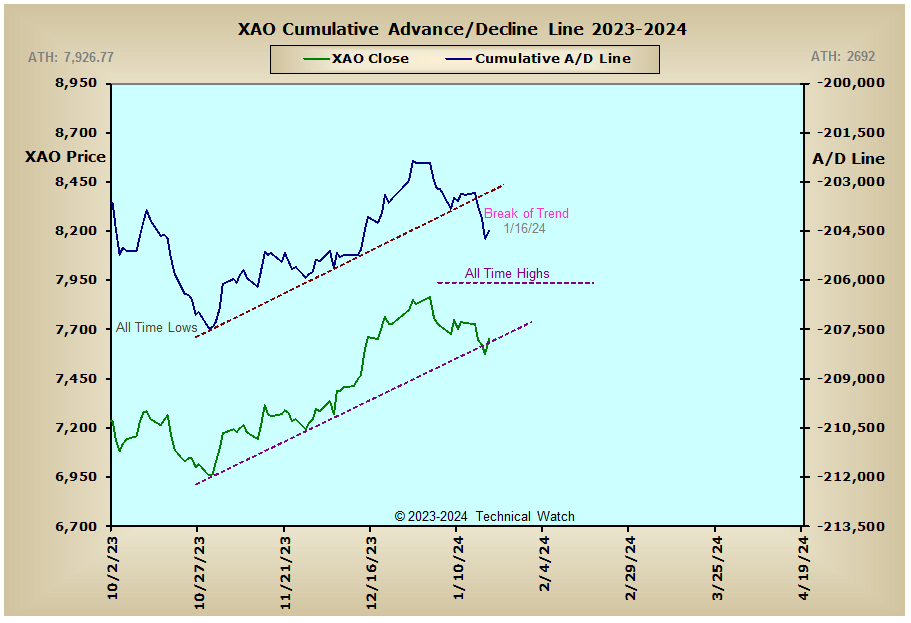
England: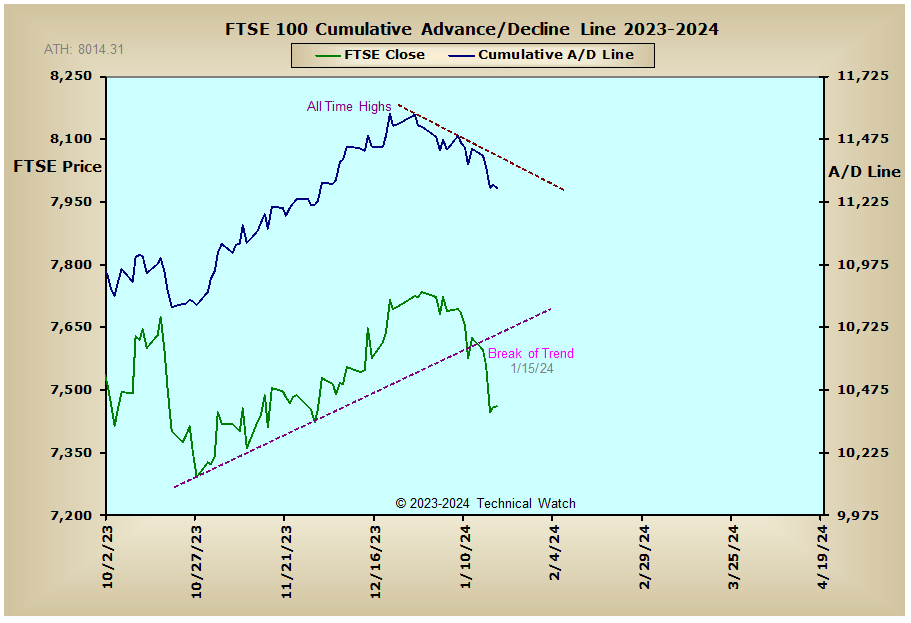
France: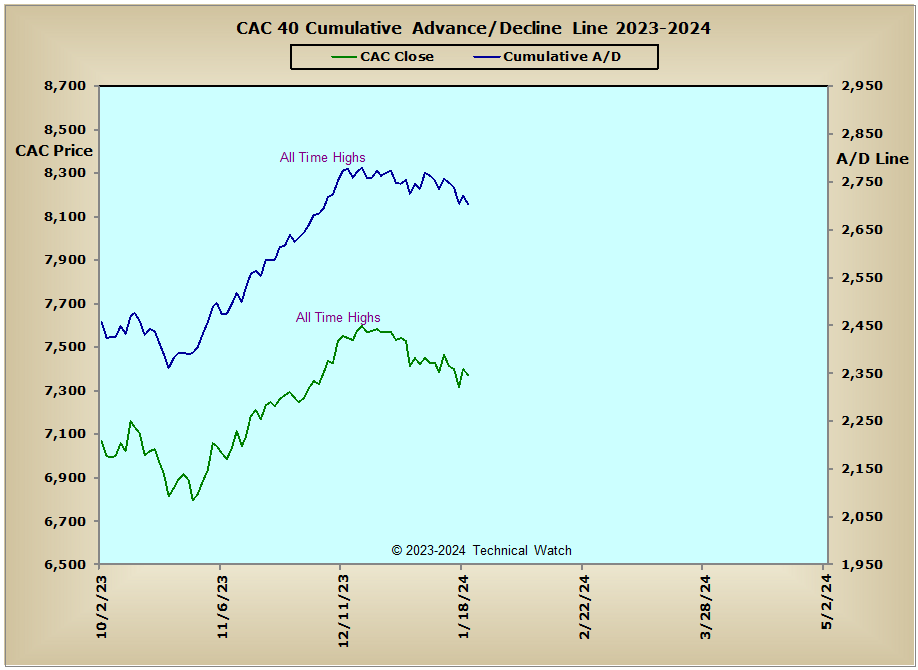
Germany: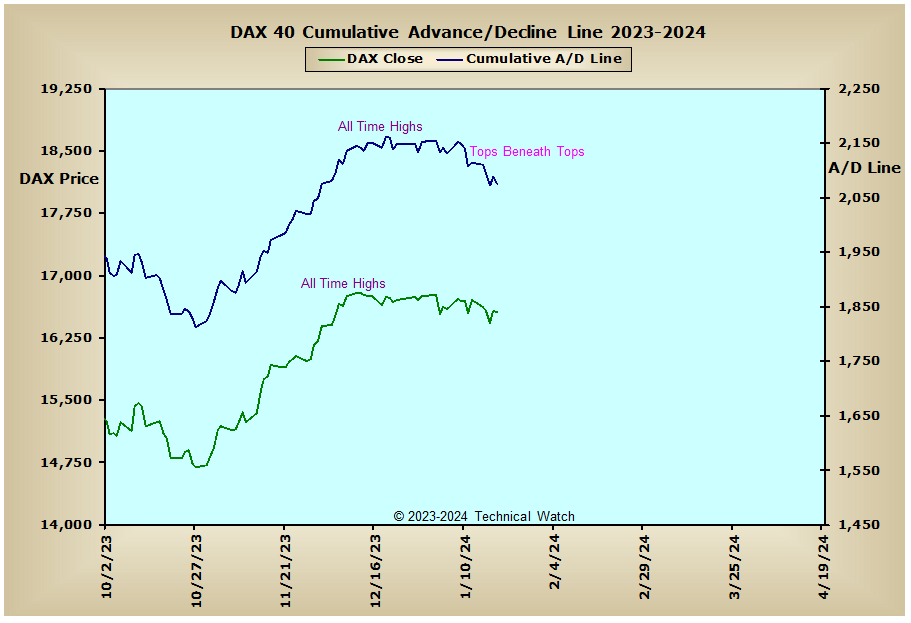
India:


