Stock market prices extended their monthly gains during the holiday shortened trading week though daily volume contracted to its lowest levels of the year. At the end of Friday's abbreviated session, index prices finished with an average weekly gain of +.90%, with the S&P 600 Small Cap Index showing the weakest improvement of only +.23% as it continues to find strong resistance at its 200 day EMA.
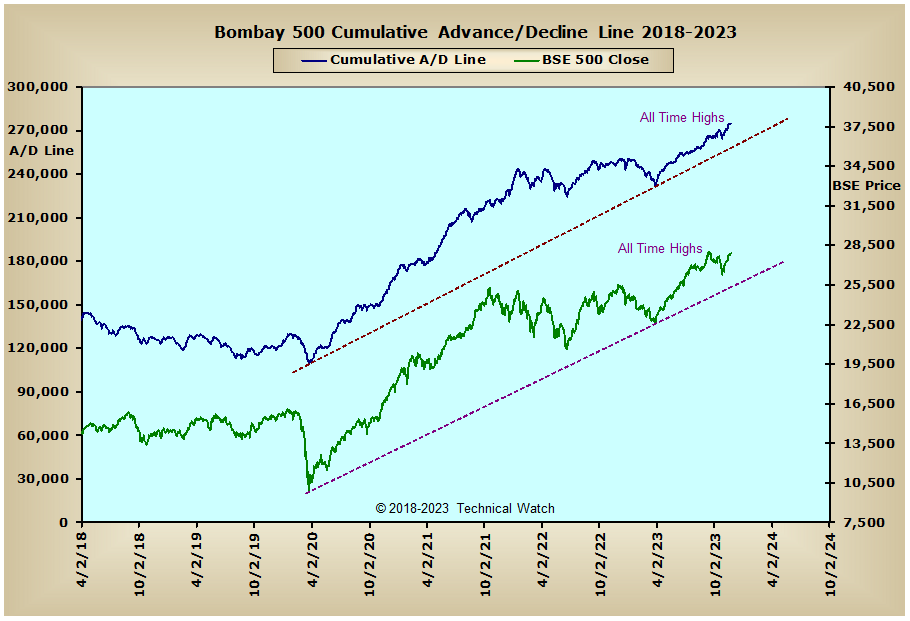
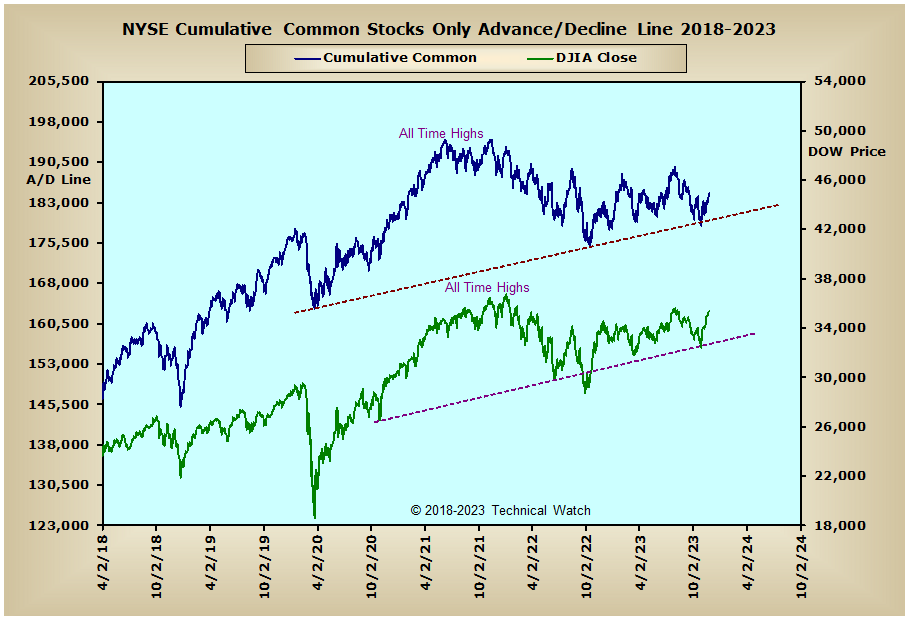
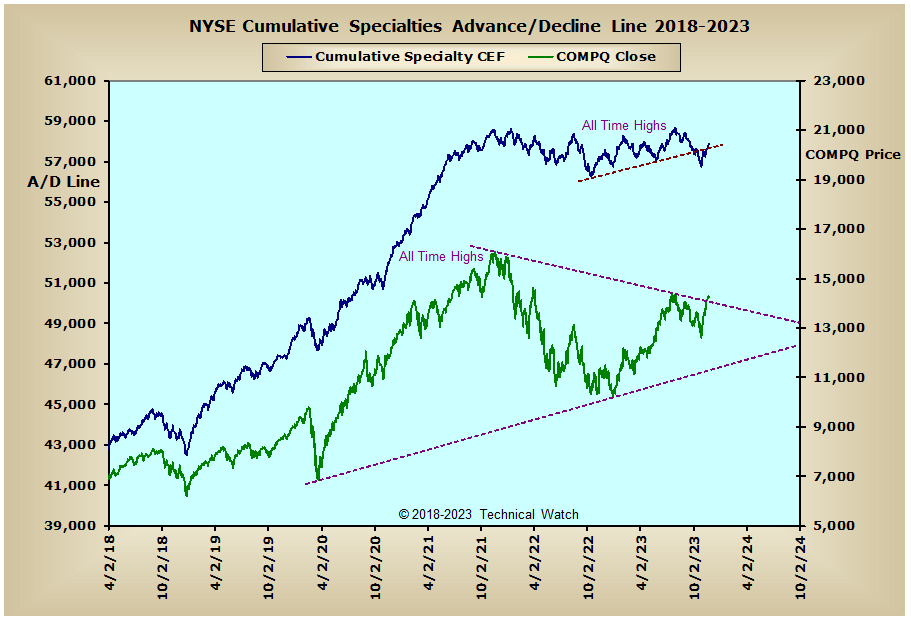
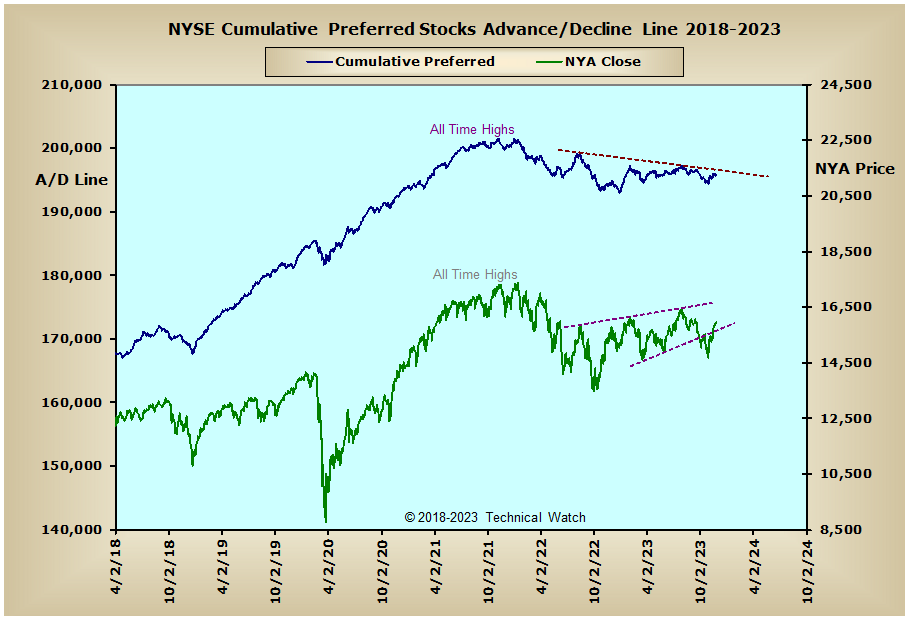
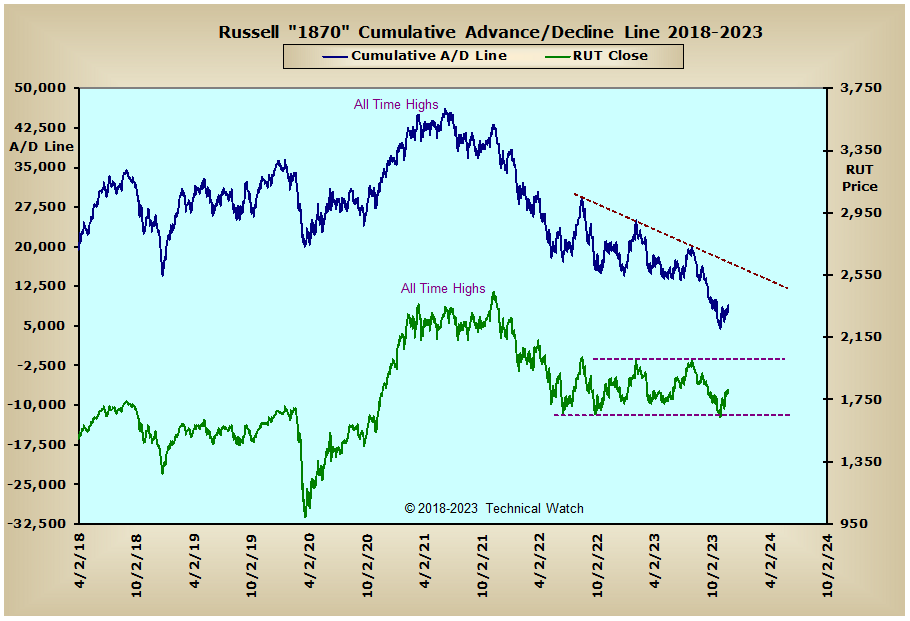
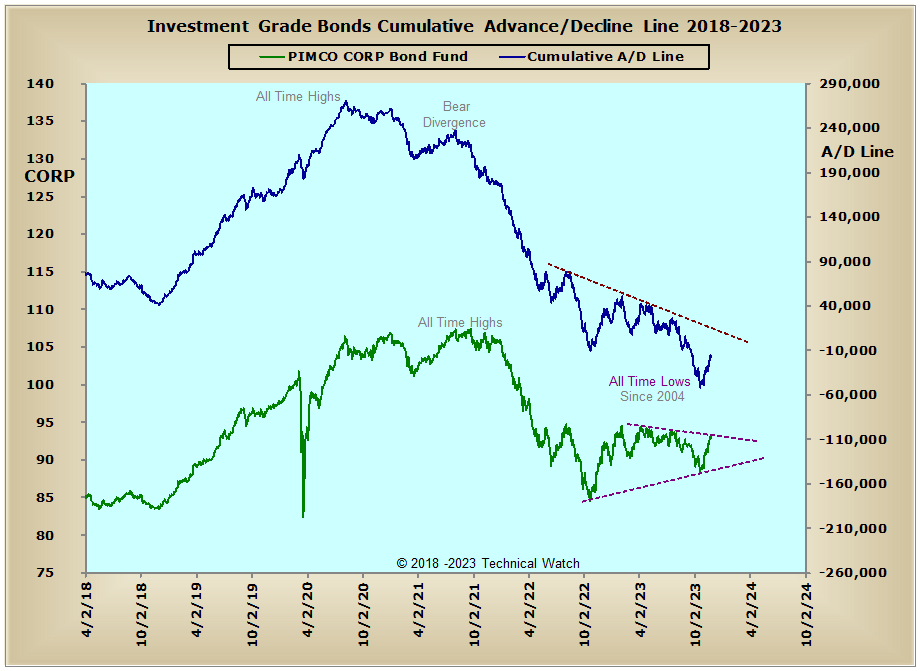
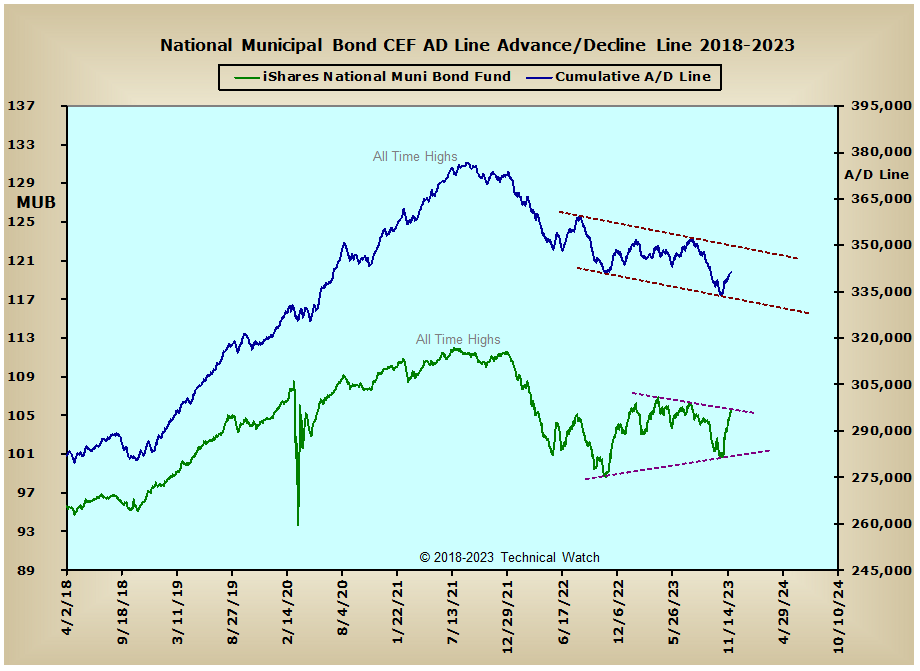
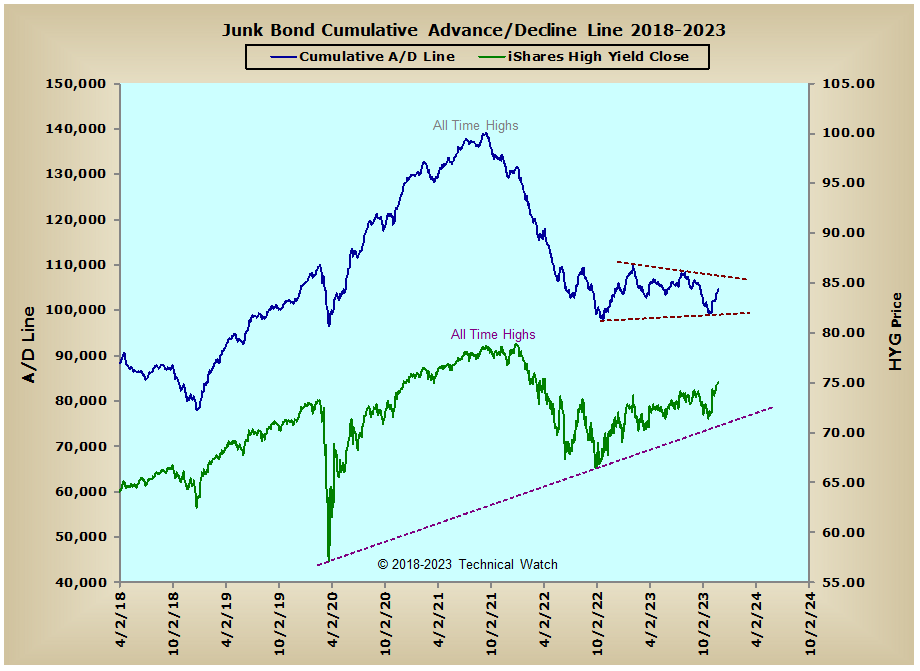
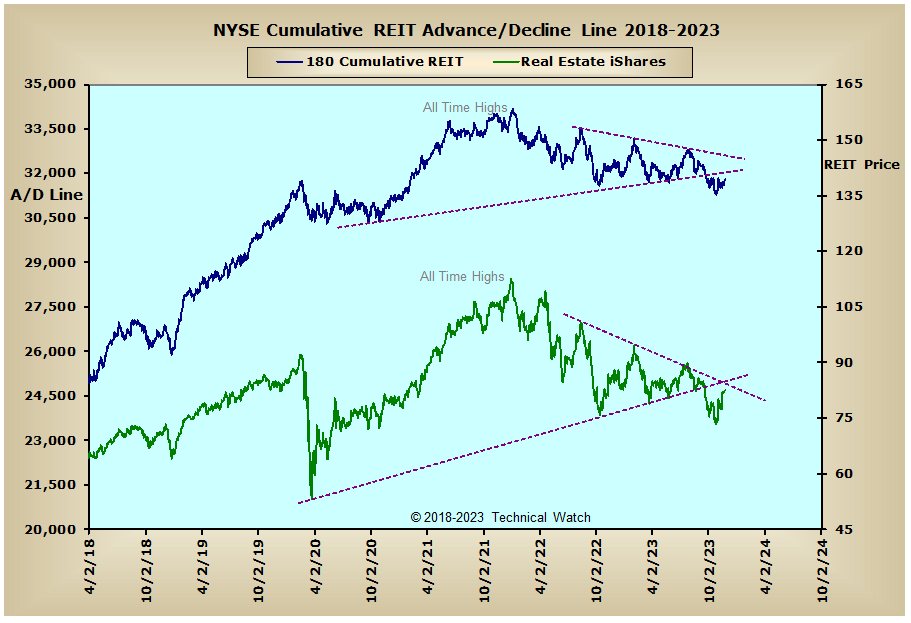
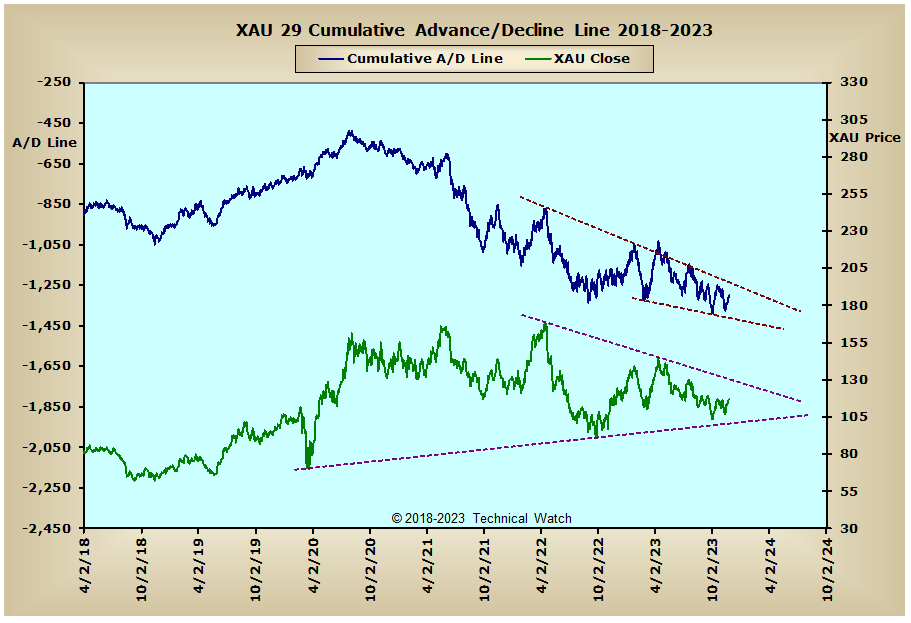
Given this month's strong price and internal performance, along with having triggered a rarefied Zweig Breadth Thrust EMA buy signal on November 3rd, I thought it might be a good time to take more of a bird's-eye view of things to provide better historical trading context. Shown below are our standard array of cumulative breadth charts with a time frame of 67 months going all the way back to April of 2018. As you can see things don't seem to be too bad when viewing this larger backdrop with the NYSE Composite, NYSE Common Only and Financials advance/decline lines still holding on to their rising trends of bottoms above bottoms going all the way back to the 2020 COVID crash and bear market lows of 2022. Also notice how strong and stable the CAC, DAX and FTSE advance/decline lines have been since 2018 including the period of 2020's COVID crash. On the flip side, we now can get a real feel of how destructive the historic selling has been in interest rate sensitive issues over the last couple of years where the Investment Grade Bond advance/decline line has been the hardest hit of the Fed's hawkish monetary policy. Higher interest rates have always been Kryptonite to the price gold, silver and platinum and the money flow charts of the Precious Metals and XAU advance/decline lines make this relationship all too clear. Another interesting observation is that even though the Russell "1870" advance/decline line has moved to its lowest levels since November of 2016, prices have been trending within a well defined trading range over the last 18 months. Is this fundamentally bullish? Or is it technically bearish? Only in the fullness of time will we know for sure. In any event, the reader may want to consider bookmarking this rather eye opening page of charts for proper context as we move forward into 2024.
So with the BETS back to a neutral reading of -20, investors and traders are now faced with a marketplace environment that's undecided. This indecision shows up well in this week's chart array as well with several internal and price pattern structures within the confines of triangles, wedges and trading ranges. Friday's shortened session was still enough to push many of the breadth and volume McClellan Oscillators to new reaction highs, and with the breadth and volume NYSE Composite Summation Indexes moving back above their zero lines, this should help prices to continue to trend higher into December's quarterly OPEX period on the 15th...especially with the S&P 500, S&P 100 and Dow Industrials. The strongest area of capital investment continues to be the NASDAQ 100 group of issues, while the weakest area remains with those considered to be that of small(er) market capitalization companies (that of $250 million to $2 billion in share value). The NYSE Open 10 TRIN settled on Friday at .99, while the NASDAQ Open 10 TRIN is nearing "overbought" levels at .82. The 10 day moving average of the CBOE put/call ratio continues to show the opinion of higher prices ahead, while put volatility premiums have smashed to new multi year lows. It should also be duly noted that the total ISEE option sentiment indicator actually saw its highest "call" reading imbalance since July 11th with Monday's rally at 153. Given the larger view of things shown above, along with recent money flow amplitude still going strong even after the initial breadth thrusts of early November, there is now enough evidence to suggest that the year ahead may not be as dire as once thought in spite of all of the fundamental, political and cultural emotional challenges that has enveloped the globe over the last three years. Furthermore, "this too shall pass" mind set should be respected if we are to continue to be market neutral when it comes to our portfolio strategies. We may not know much (or have control) of what lies ahead in this business, but if the demand for equities outstrips the supply available, this simple concept does suggest that looking for reason to go against this predominate tide will be nothing more than an exercise of futility. Because of this, now would be a good time to take a new approach with our market blueprints by working with the idea of moving long those issues that continue to show upside leadership, and if interest rates remain stable to lower, this may also be a good time to look at the growth stocks that make up the S&P 400 and S&P 600 indexes for future "undervalued" buy points. So outside of any near term pullback to relieve the current "overextended" buying patterns of the last couple of weeks, let's look for choppiness to continue for the week ahead with, again, any surprises to likely have an upside bias.
Have a great trading week ahead!
US Equity Markets: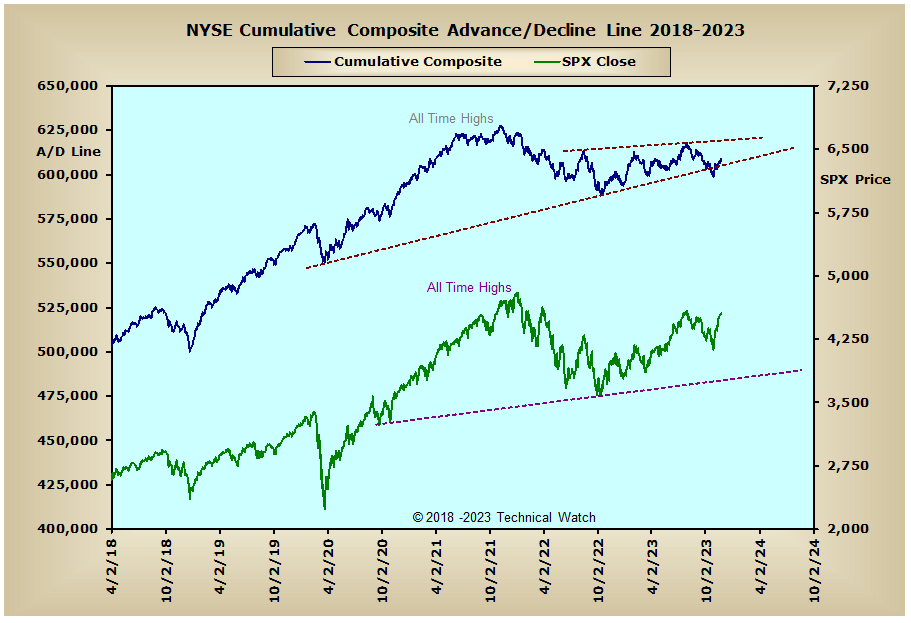
US Interest Rates: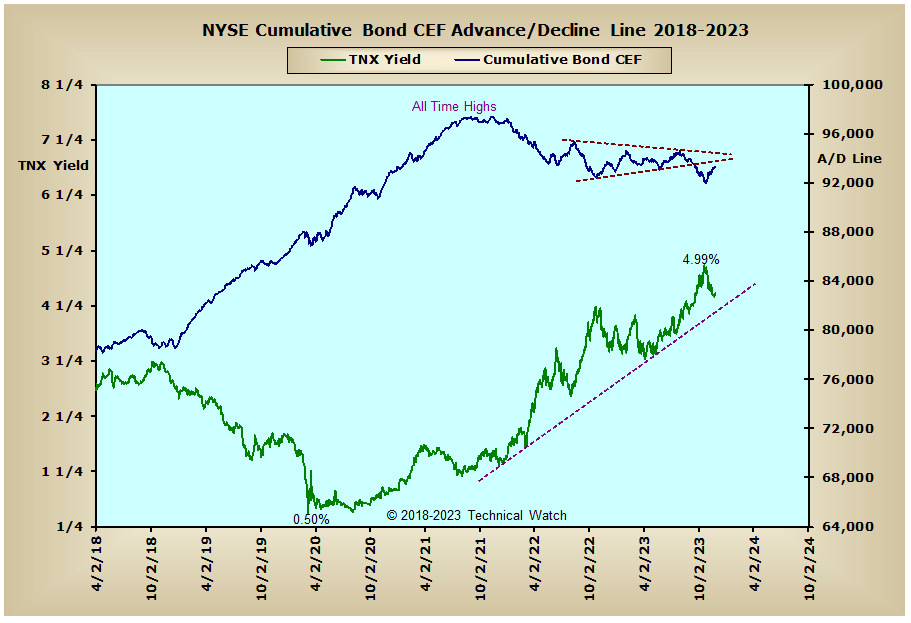
US Sectors: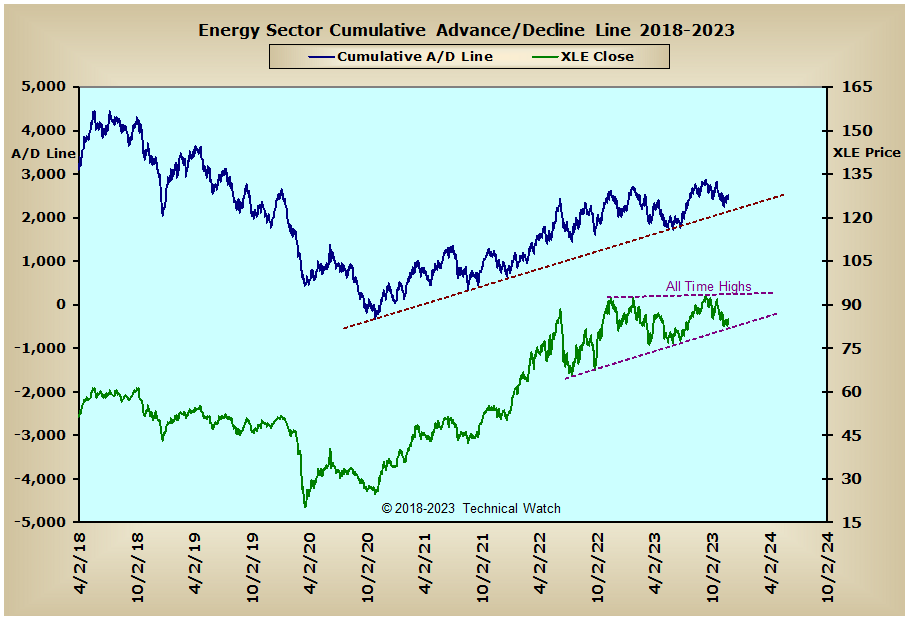

Precious Metals: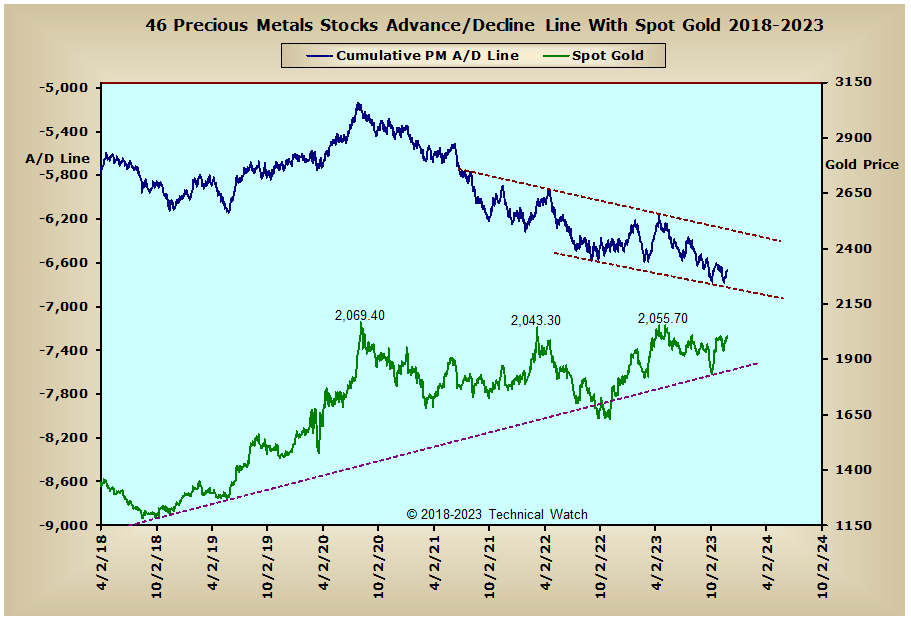
Australia: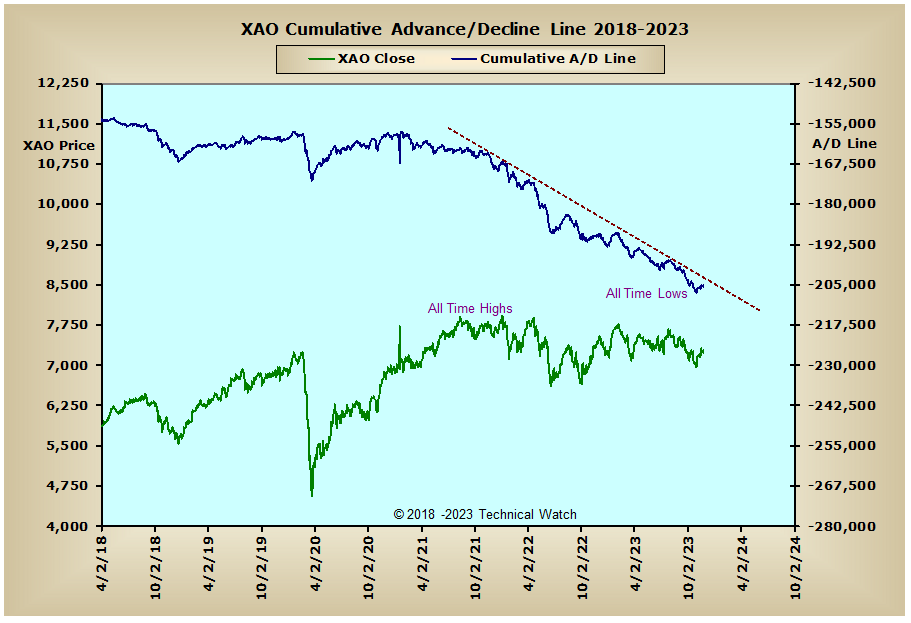
England: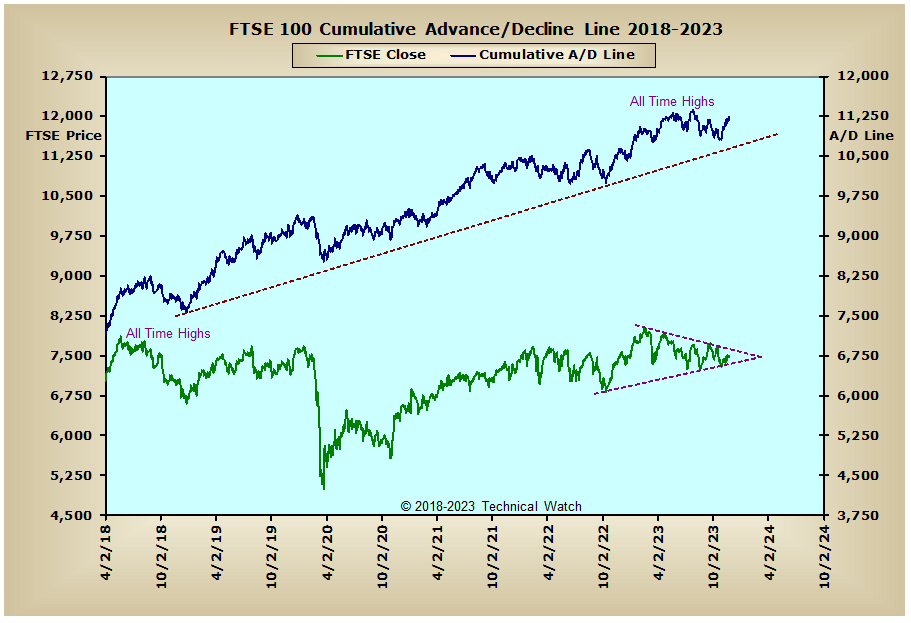
France:
Germany:
India: