With the above technical data providing the needed tailwind for the bulls, the major market indices finished on Friday with a sizable average gain of +6.41%...its largest weekly gains since the first week of November of 2020 when the tally was +6.96%. Market participation was balanced with the NASDAQ Composite Index leading the way higher by +6.84% after finding support at its 200 week EMA. This higher market close also broke a seven week long losing streak. With one trading day left in May, it should also be noted that we now have an average monthly gain of +1.04% as we begin things on Tuesday.
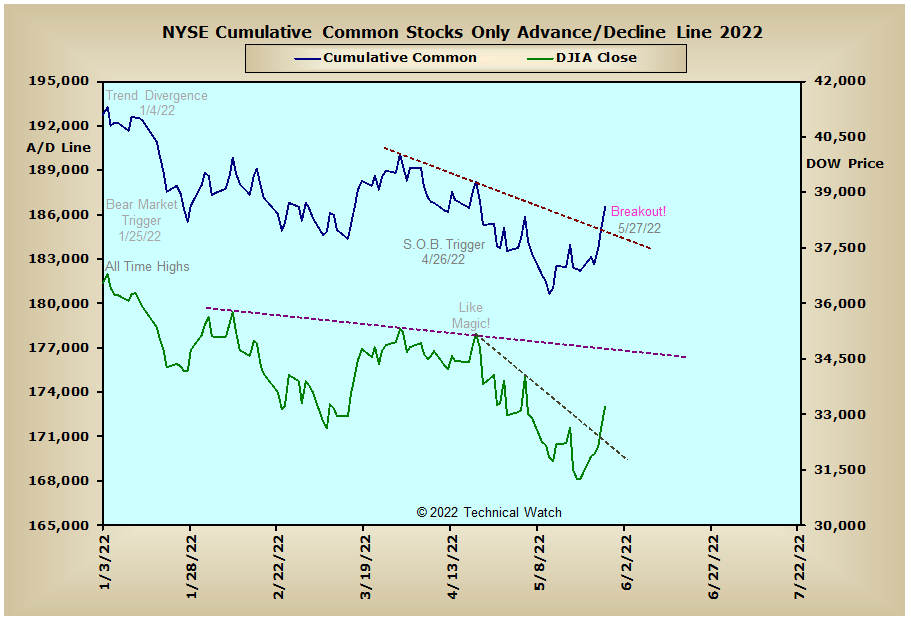
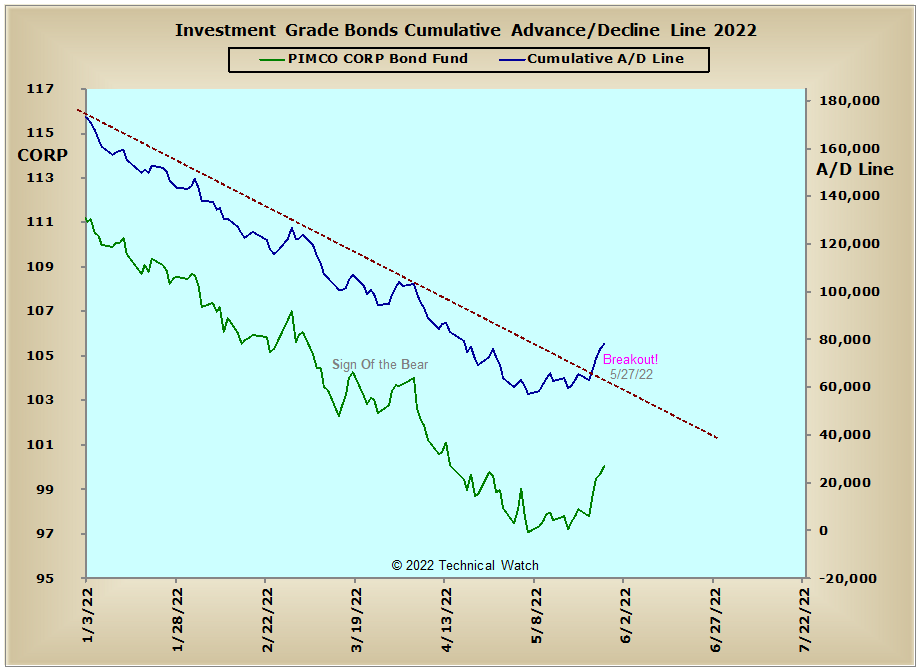
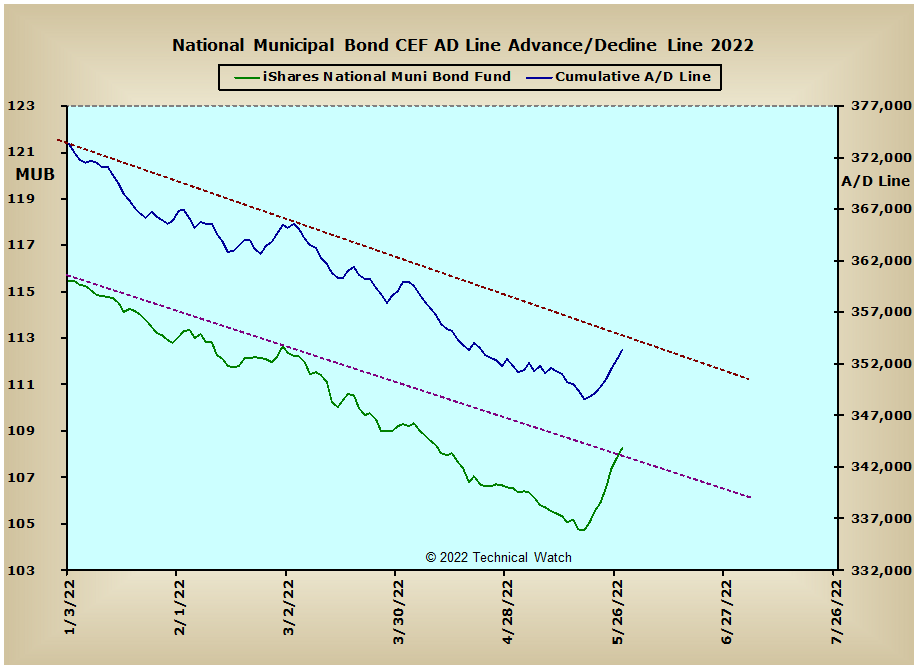
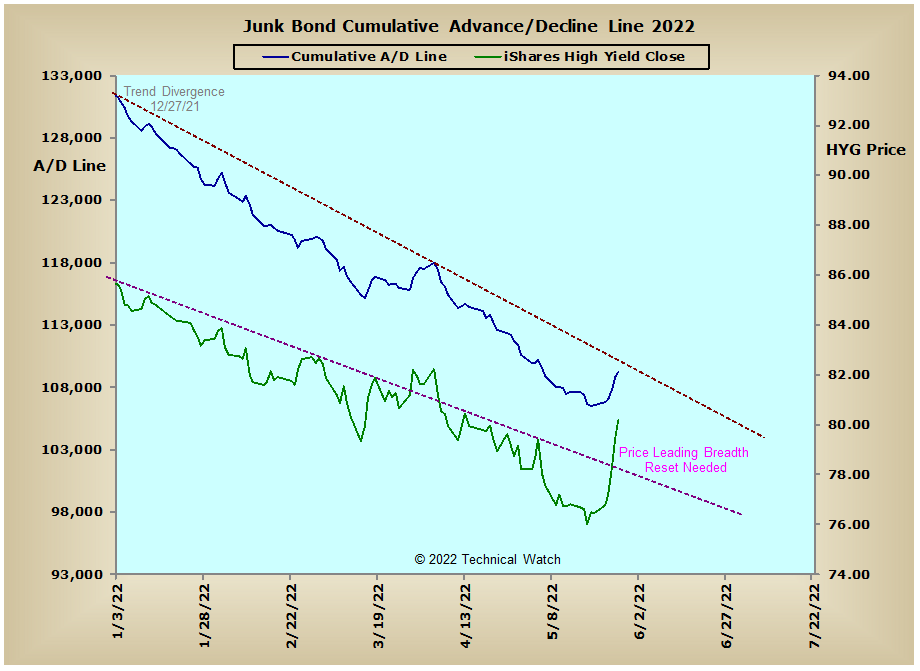
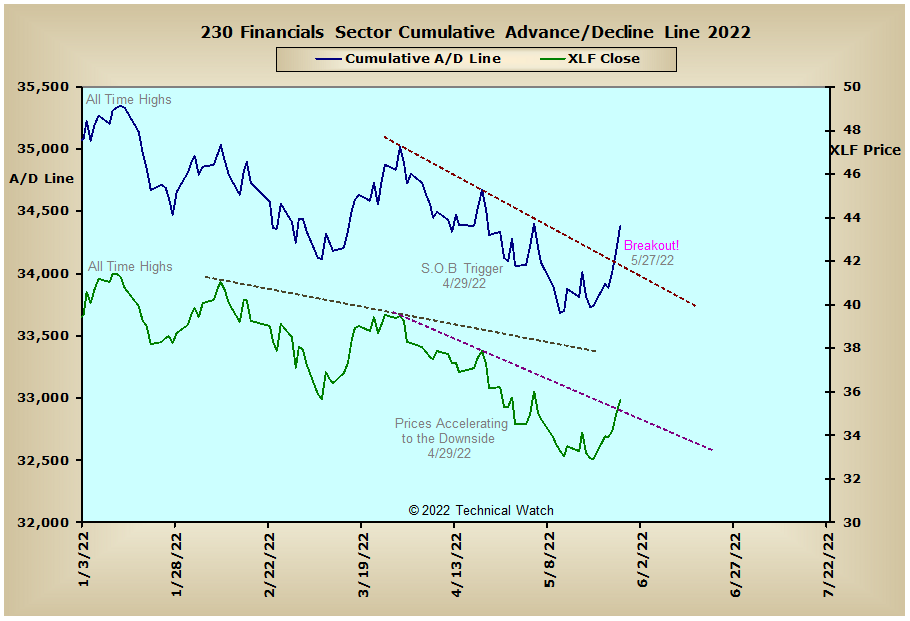
Looking at this past week's money flow charts shows several multi week trendline violations to the upside which included the NYSE Composite, NYSE Common Only, Russell "2051" and Financials Sector advance/decline lines. Also moving above its longer term declining tops line last week was the Investment Grade Bond advance/decline line though the NYSE Bond CEF, Junk and Municipal Bonds advance/decline lines remain with a negative bias even with the sharp recovery. Also doing well is the Energy Sector advance/decline line which continues to power its way to the upside. With the implication of even higher fuel prices just around the corner, this will likely keep any upside progress in the equity markets well contained and precious metals sneaking higher on a short term basis (that of the next 4-6 weeks in duration).
So with BETS moving sharply higher to a reading of -30, investors should now apply protective stops on any open short positions. Looking at both the breadth and volume McClellan Oscillators and we see that the vast majority moved above the +100 level on Friday. Readings this high do provide us with technical "breadth thrusts" that do suggest an important low in prices is now behind us. This also suggests that prices will be quite buoyant as we go into this year's 2nd quarter quadruple OPEX period on June 17th. Trading on Friday also provided us with a rare Zweig Breadth Thrust buy signal as the average number of advancing issues moved from below 40% to 63% on an EMA basis, but did so in 11 days and not the standard 10 day period or less criteria. Whether this rapid surge of added fuel will help with the current liquidity problems the market is facing with a hawkish FED remains to be seen, but it should be respected as to its longer term implications.
In other areas, and after last week's "oversold" extremes in the NYSE Open 10 TRIN, we note that this indicator closed on Friday only minimally "oversold" at 1.00, while the NASDAQ Open 10 TRIN finished nearly neutral at .91. The 10 day average of the CBOE put/call ratio showed a rush of call buying with the market's upside reversal, while implied put option premiums finished on Friday near its lower Bollinger Band of short term support. With a large majority of Trinity EMA's (20/50/200 day) on both the cumulative breadth advance/decline and volume up/down lines still in a bearish configurations, last week's thrusts were a positive note overall, but there's still quite a bit of work still yet to do by the buyers before we can confidently say that the worse of this bear market sequence is behind us. Currently, the large caps continue to be the area of best opportunity for the bulls during this rebound, while those issues that are "less deserving" (such as secondary and small cap issues) will be choppy and highly vulnerable to any misses in both earnings and/or profit margins. With all this as a background then, and with a whole slew of economic reports due out in the coming week, let's go ahead and take a more neutral posture toward equities as we begin the week ahead as the market begins to work off the near term "overbought" extremes created by the previous week's "tension on the tape".
Have a great trading week!
US Equity Markets:

US Interest Rates: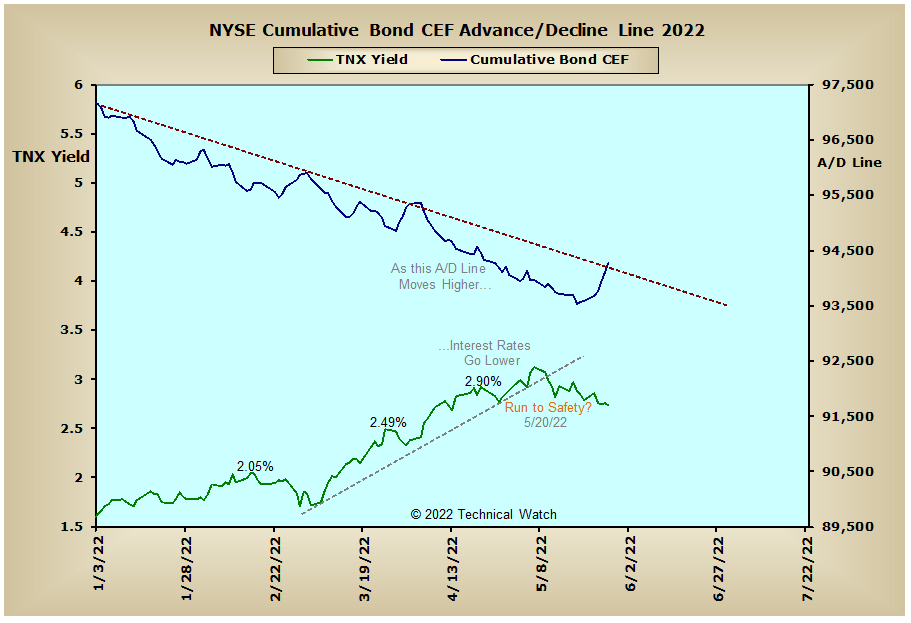
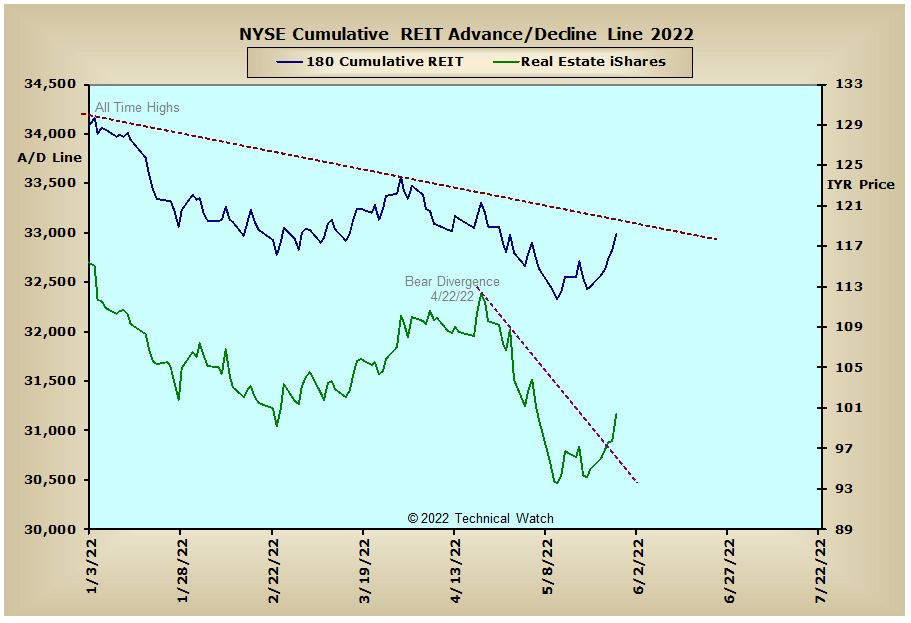
US Sectors:
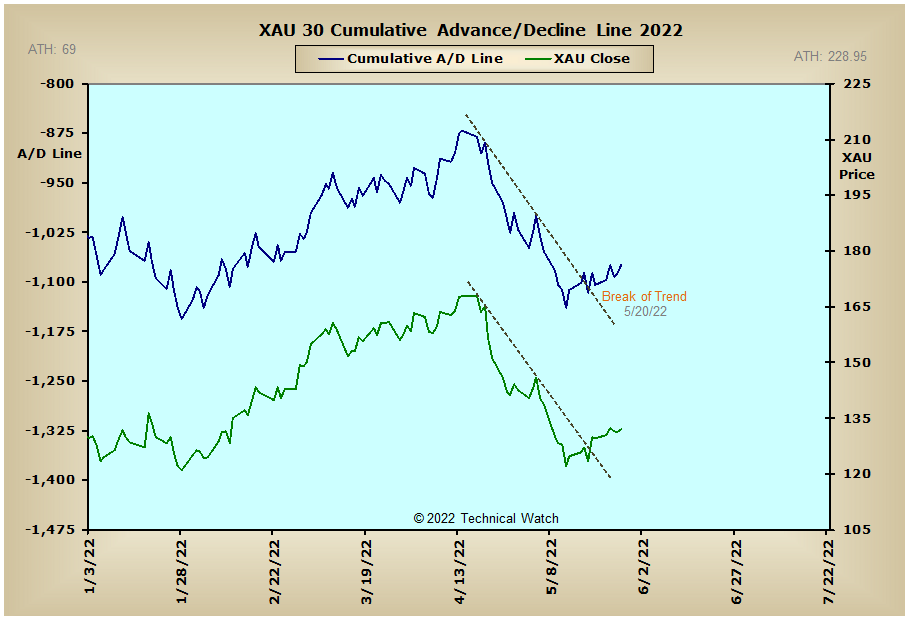
Precious Metals: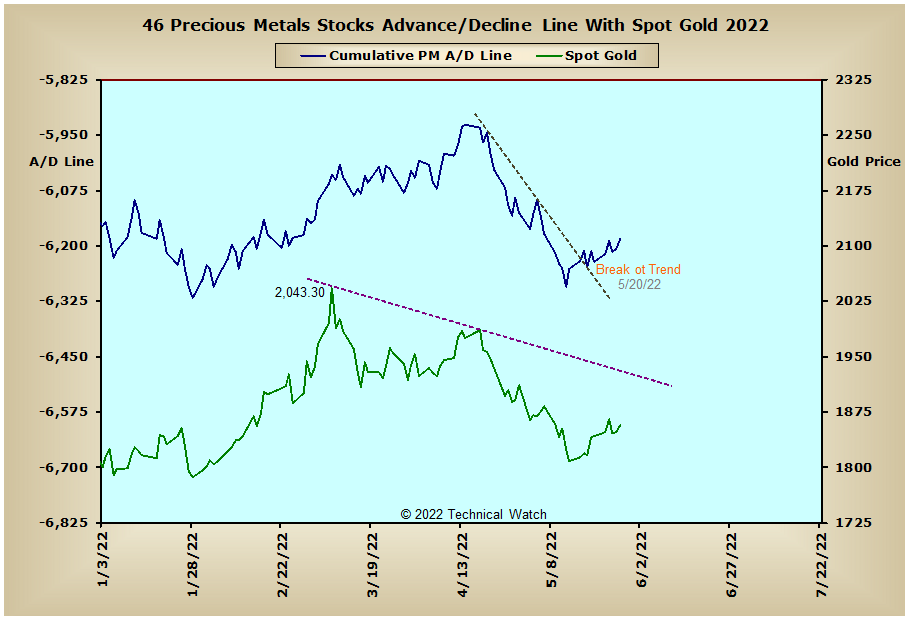
Australia: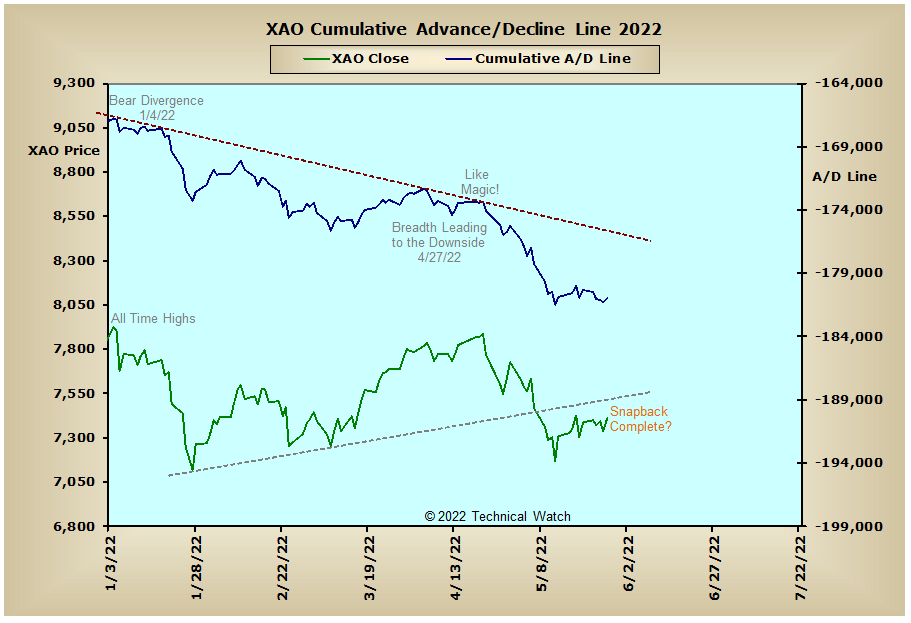
England: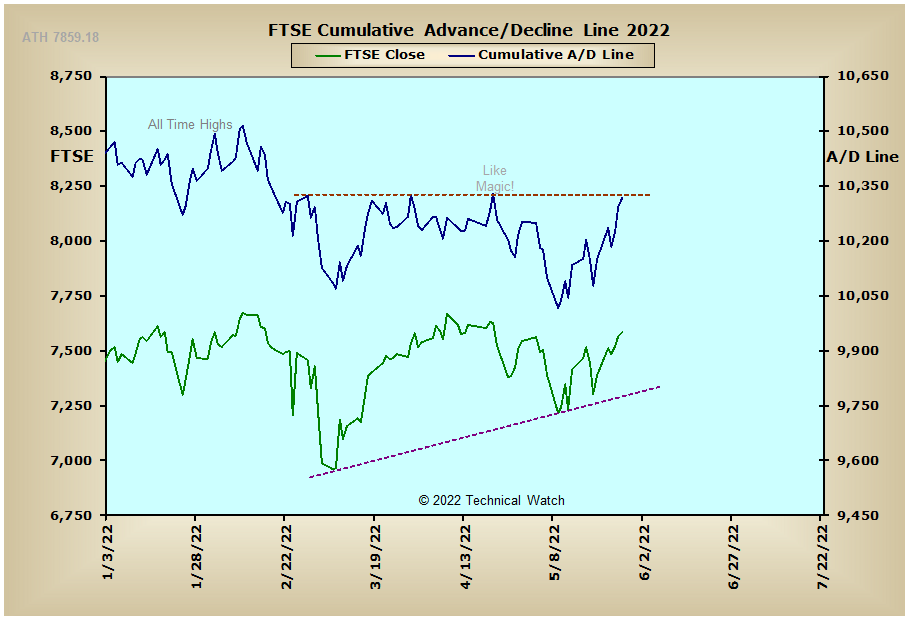
France:
Germany: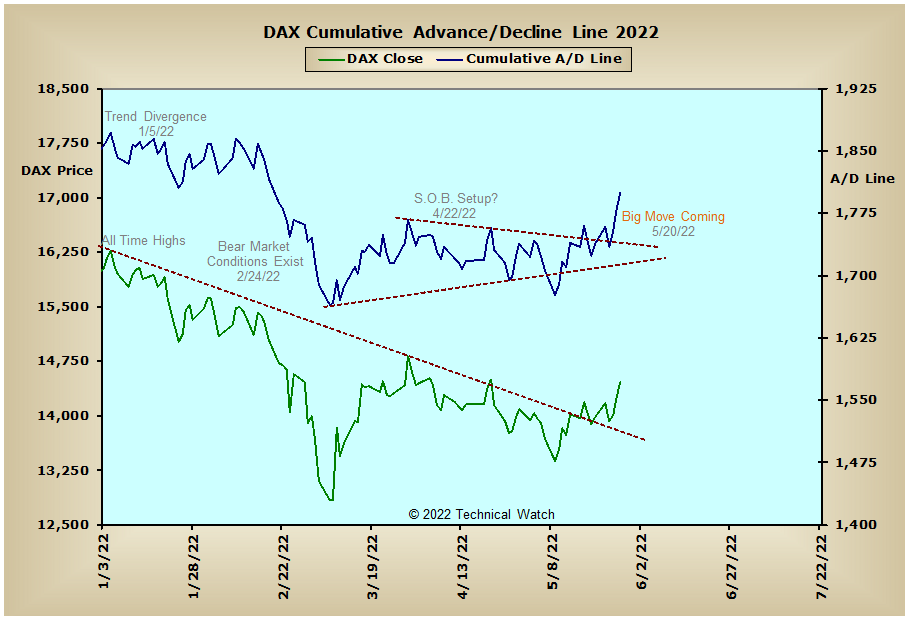
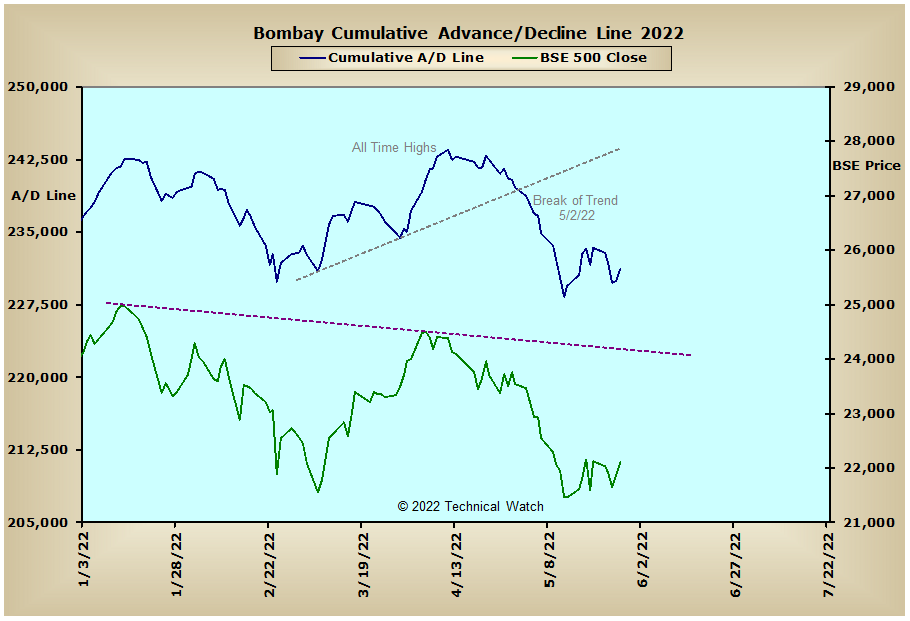
India: