After seeing a lessening of selling pressure just before the 3 day holiday weekend, the major market indexes continued their about-face on Tuesday as prices closed out the week by rallying sharply on Friday to finish an average gain of +5.79% and almost wiping out the average losses from the week before. Leading the reversal was the NASDAQ Composite group of stocks which ended the week with a gain of +7.49%, while the New York Composite Index was the weakest gauge on the equity Totem Pole although it did tally a highly respectable jump of +5.07%. Also of note for the week is that all of the major market indices regained their 200 week EMA's, while the daily charts showed a preponderance of prices closing at or near their 20 day EMA's.
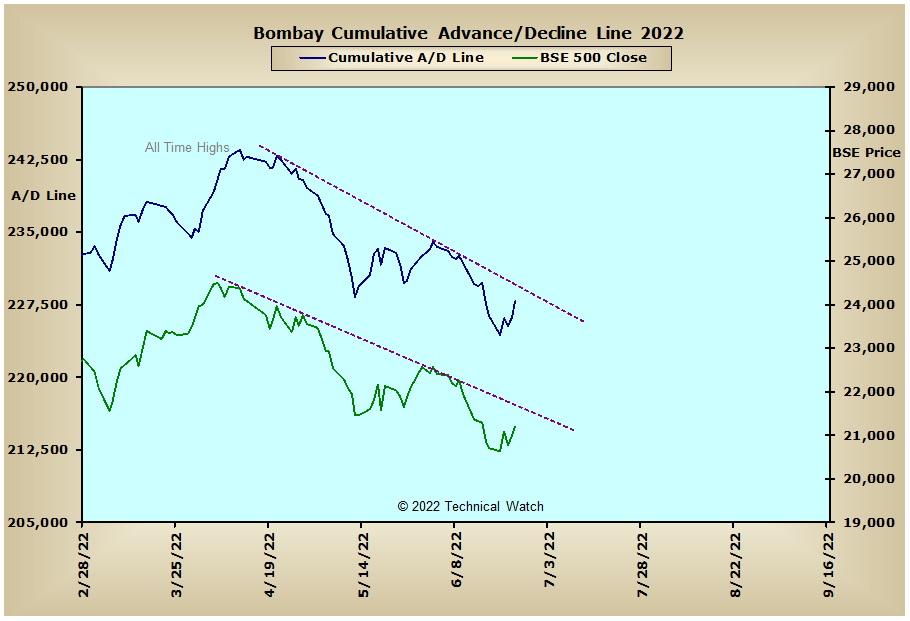
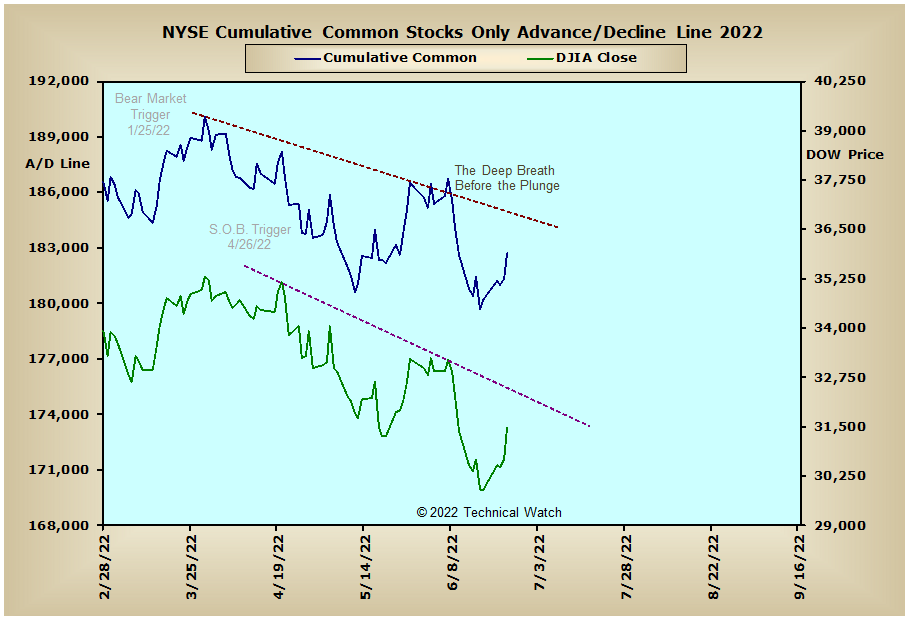
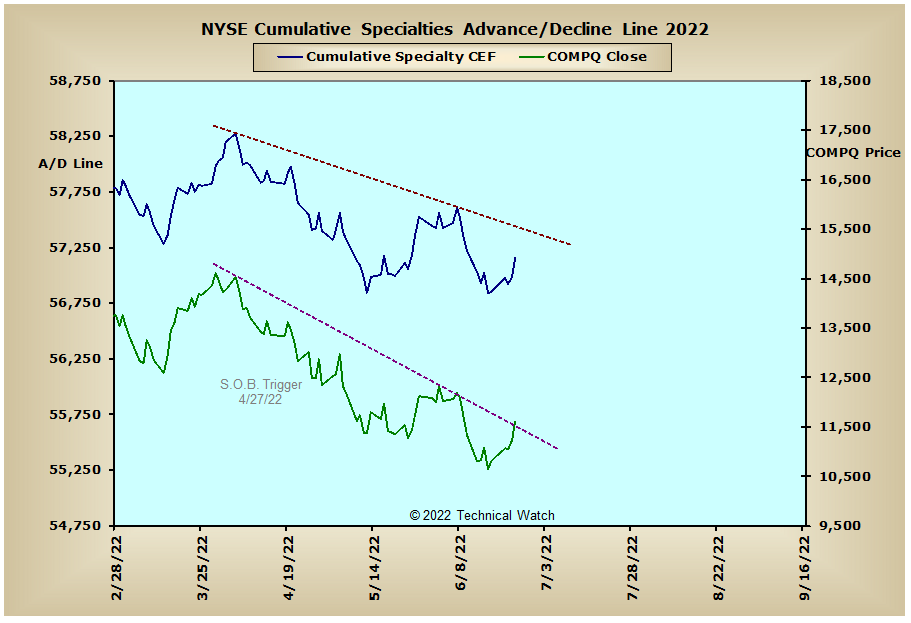
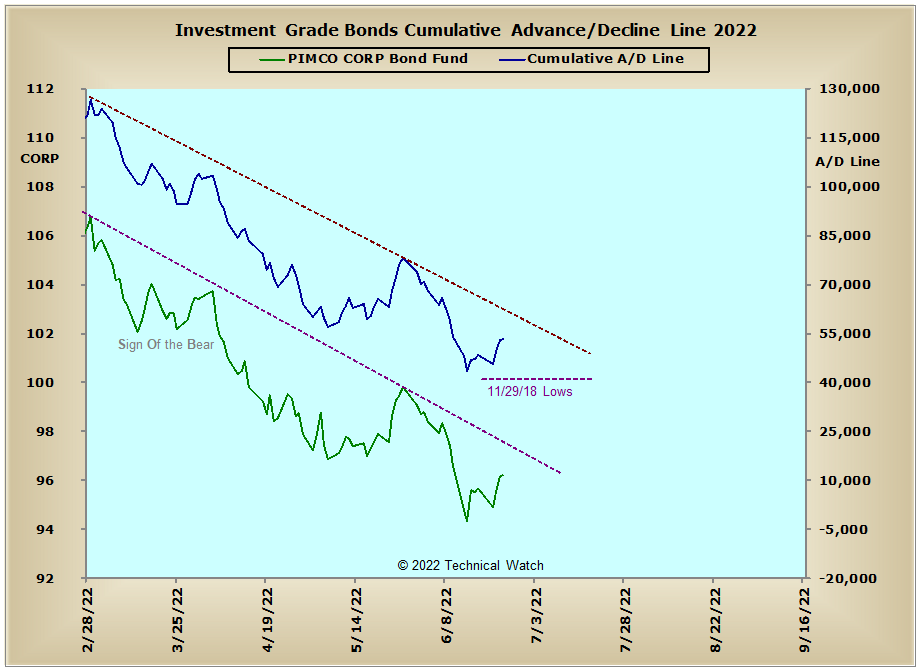
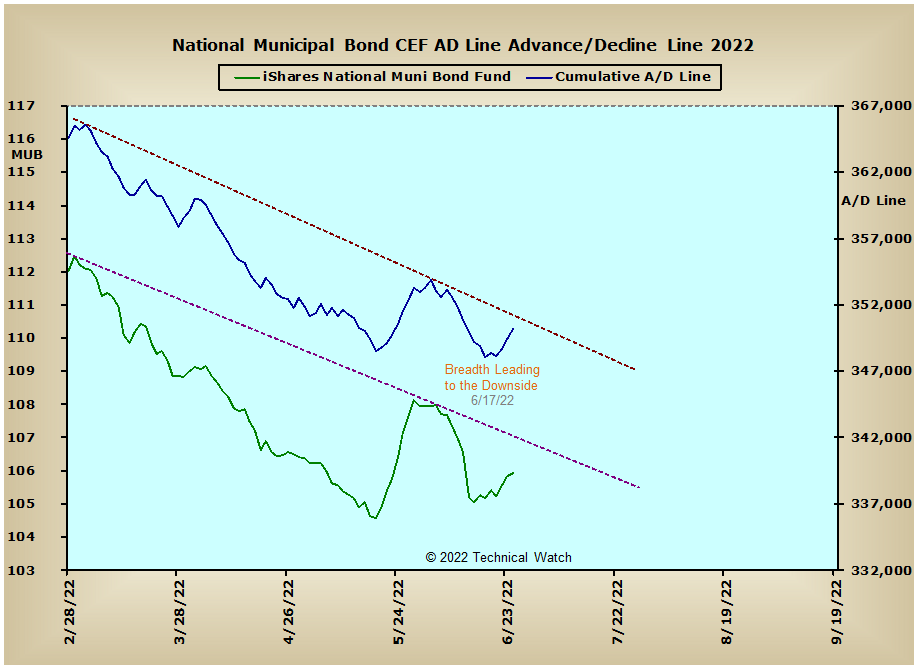
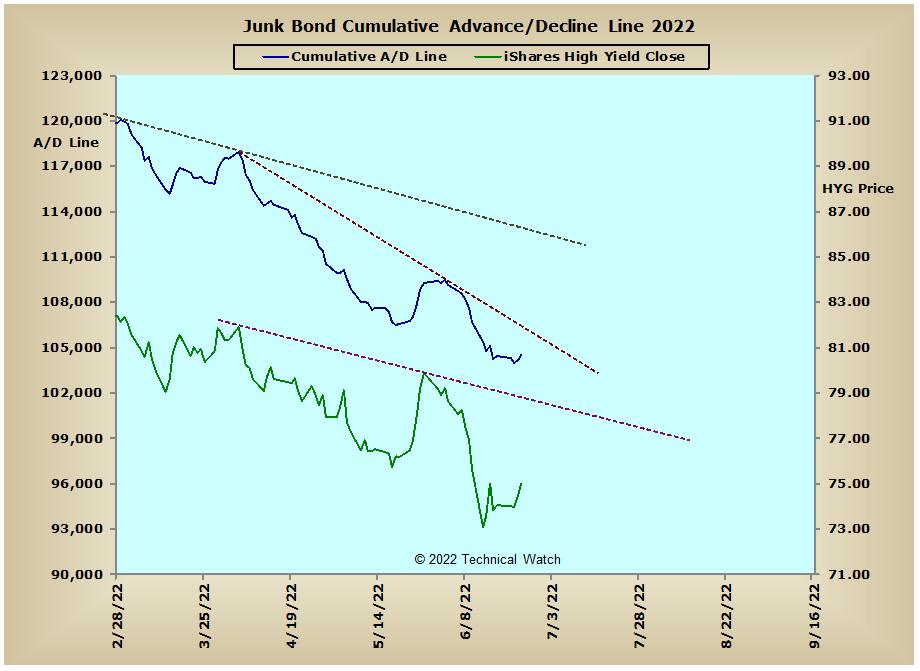
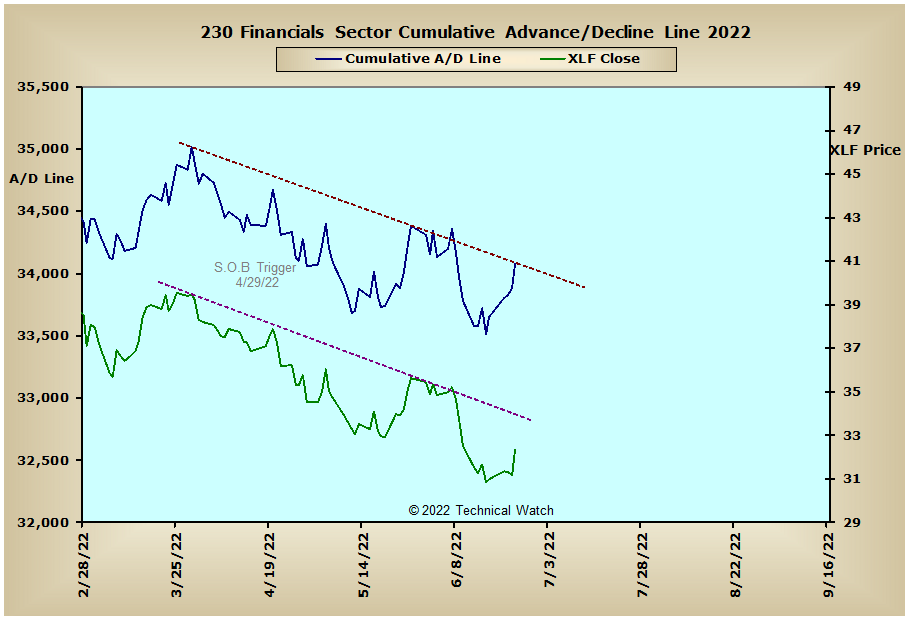
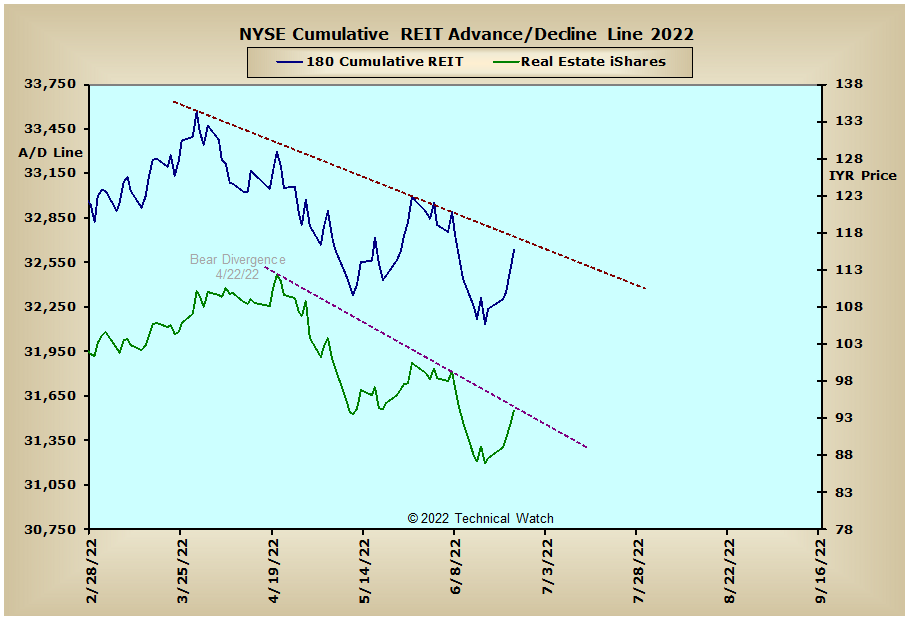
Looking over this week's array of cumulative breadth charts shows that all of the U.S. equity and interest rate sensitive advance/decline lines continued to be controlled by their intermediate term declining trendlines. We also see the same thing in the precious metals related A/D lines, as well as, the Aussie and Bombay advance/decline lines. Selling continued in the Energy Sector advance/decline line as it finished on Friday just below its trendline of support that goes back to March. Given that XLE prices are still leading this breadth indicator to the downside, it wouldn't be too surprising to see petroleum related stocks rally this coming week to provide a needed technical reset before we see a nominal top in WTIC prices.
So with the BETS moving higher to a reading of -55, traders and investors remain with a bearish bias toward equities. As we start the week ahead, all of the breadth and volume McClellan Oscillators find themselves in positive territory though the short term trend of volume, as measured by this same tool, is showing a weaker amplitude. This would suggest that the make up of last week's bounce was that of short covering, and once that's exhausted, prices will begin the process of filling the vacuum created by this same imbalance of money flow. Another technical consideration is that although we do have many bullish divergent MCO structures that were created before June OPEX, they will not be triggered until these respective MCO's are able to climb back above their early June highs. On the plus side for the buyers, we see that the NYSE Open 10 TRIN remains stubbornly "oversold" with Friday's reading of 1.38, but the sellers also have something to crow about with the NASDAQ Open 10 TRIN as it remains at near "overbought" levels at .84. The 10 day moving average of the CBOE and Equity put/call ratios are currently diverging with the early May period (less put buying with the recent price low), with implied put premium volatility nearing their lower Bollinger Bands which offers a complacent element to the mix. Besides rebounding to around their 20 day EMA's, the great majority of the index price charts have now only reached (or are just below) their 50% levels of the 13 day Relative Strength Index (RSI), while the Percentage Price Oscillator (PPO) remains with a negative bias overall due to prices moving too far and too fast with Friday's rally. With the cumulative advance/decline lines shown with this weekly review continuing to trend to the downside, the overall outlook is for a rough start for the week ahead that could turn into something more hostile as we go into another 3 day holiday weekend here in the states. With all this as a backdrop then, let's again continue to walk along the longer term bearish path of least resistance, with any near term surprises likely to have a more bearish viewpoint.
Have a great trading week!
US Equity Markets: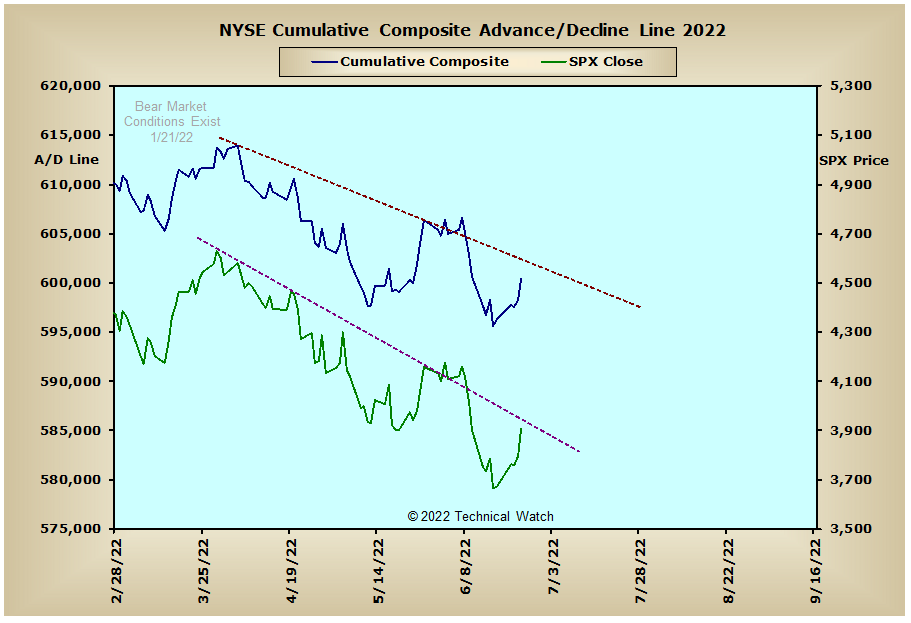
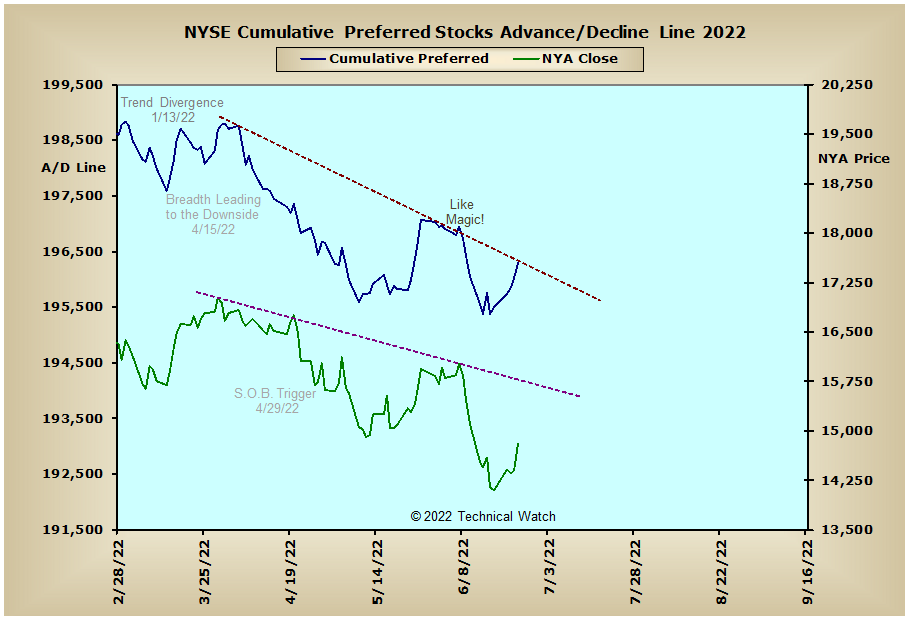

US Interest Rates:
US Sectors: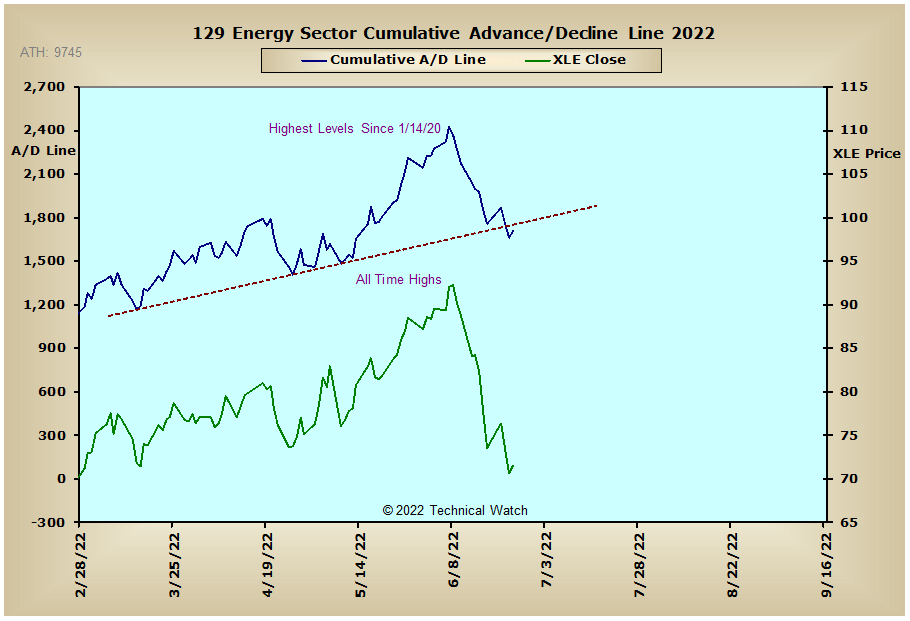
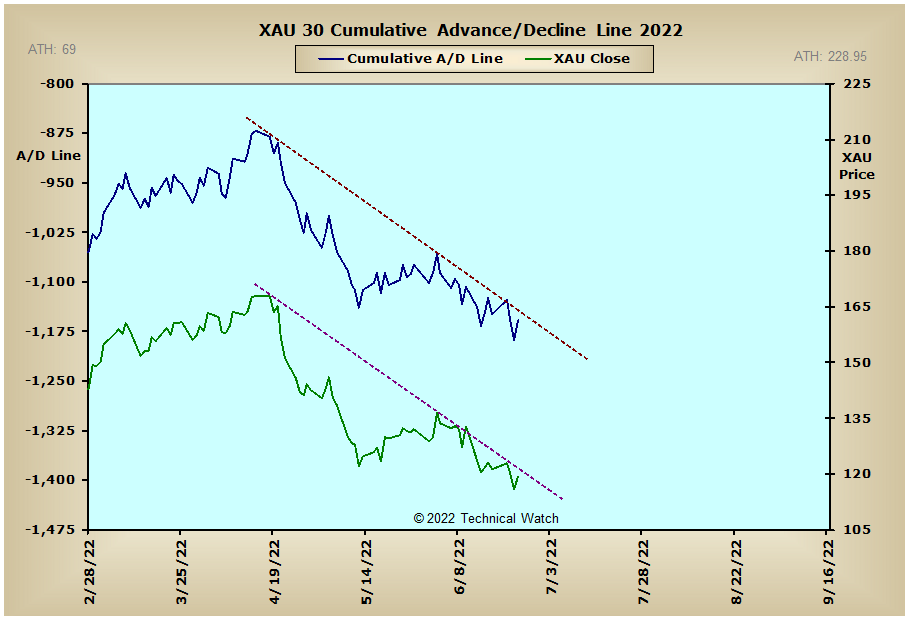
Precious Metals: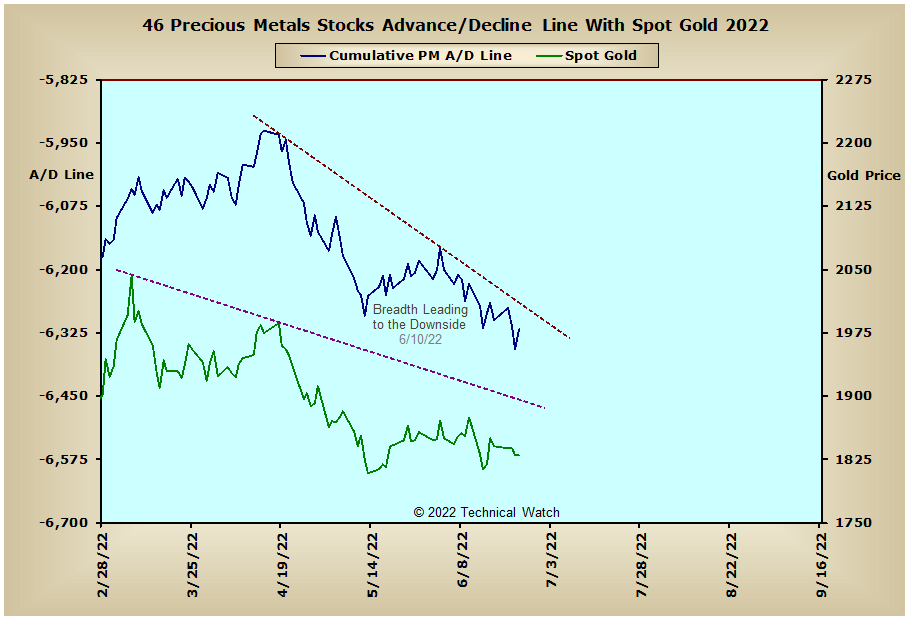
Australia: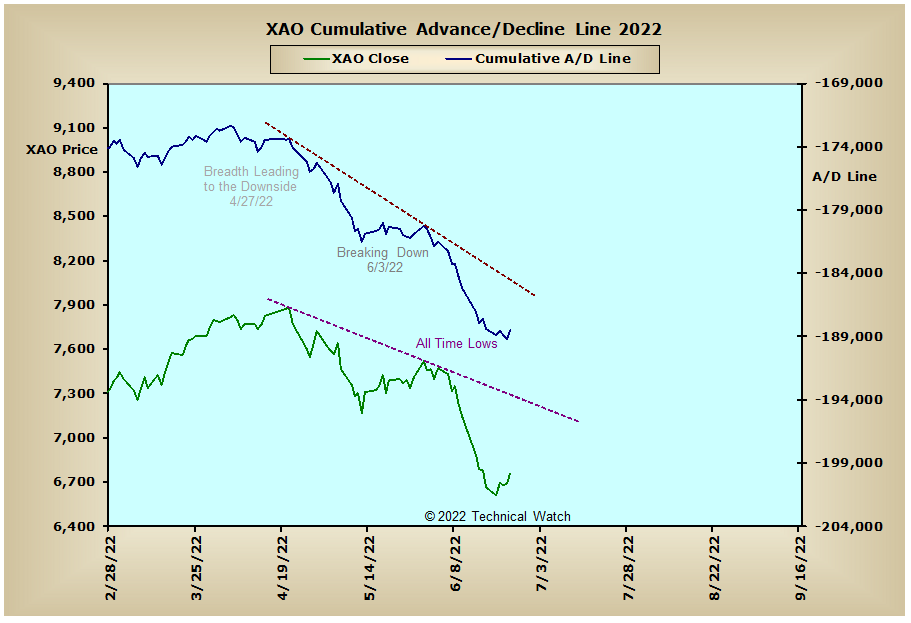
England: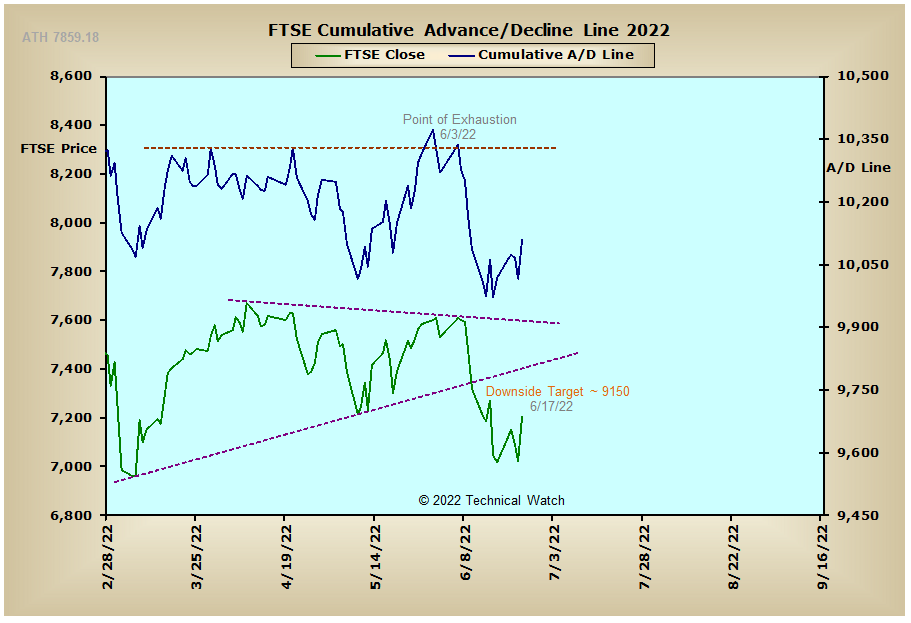
France: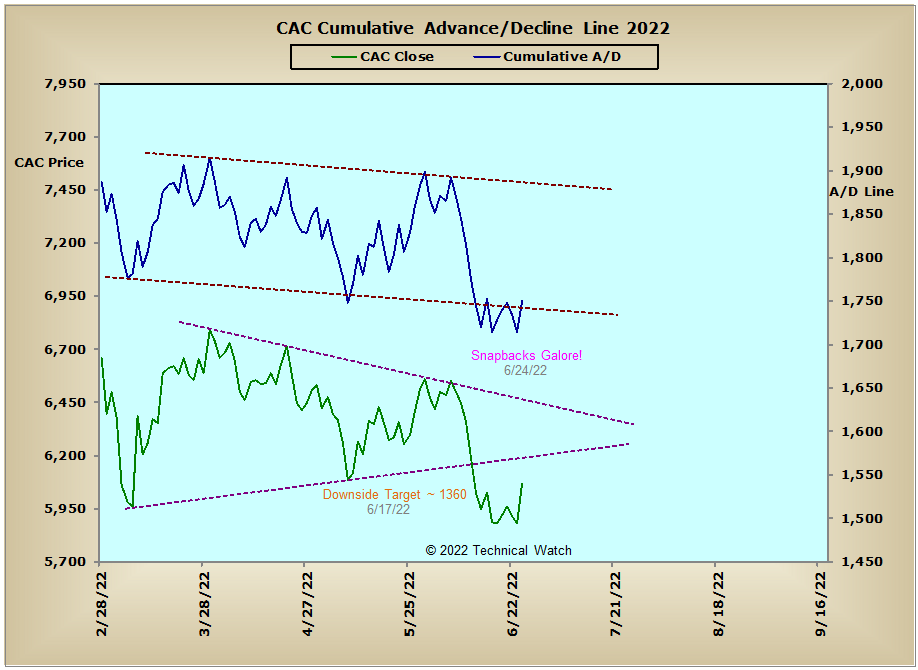
Germany: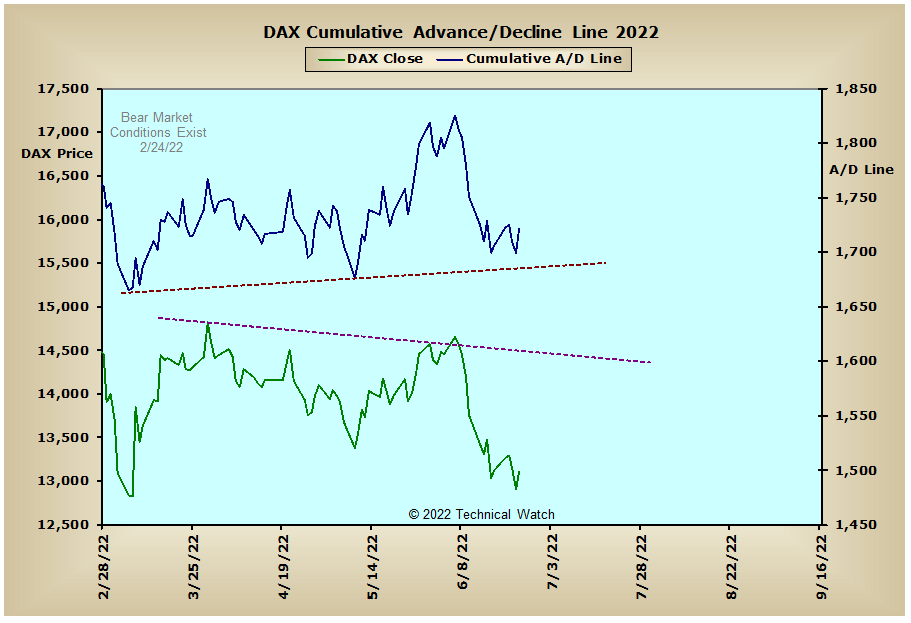
India: