Jump to content


Photo

Markets on the EDGE -- can BULLS prevent another leg down?


  • Please log in to reply
226 replies to this topic

#1 dTraderB

dTraderB

    Member

  • Traders-Talk User
  • 17,659 posts

Posted 21 August 2022 - 09:12 AM

No, does not seem likely as global economic, financial, and political situation worsens

--

Latest:

CHINA'S SICHUAN EXTENDS FACTORY POWER CUTS TO AUGUST 25TH - CAIXIN

--

Power cuts & COVID SURGEs in China, many other places, but the most worrying possibility is a WINTER OF MISERY in EUROPE: war, less gas, economy plunges into recession.... 


Can POWELL et al in JACKSON HOLE  bail out the market again ? Maybe, for a week or two, but the is the very high probability of a disastrous Winter.


The good news is this will be the WORST, the world - especially EUROPE - will rapidly increase usage of renewables, and a new BUUL MARKET begins in 2023. 


#2 dTraderB

dTraderB

    Member

  • Traders-Talk User
  • 17,659 posts

Posted 21 August 2022 - 09:22 AM

BARRON's said the US in a recession now; it is, but many are in denial. 


Despite the market bounce driven by the release of federal oil reserves, small businesses and households are straining under the pressure of still-high inflation, an unbalanced labor market, and dwindling savings.

https://www.barrons....d=past_editions


here is another indicator that supports an ongoing recession:

@AvidCommentator
· 1h
The Dreaded Inflation Yo-Yo - A Thread -
Currently U.S trucking costs are seeing big falls as retailers are faced with record levels of inventory (h/t @FreightAlley - In time this will hit the trucking sector hard, its stuck between falling contract prices and rising costs.

https://twitter.com/...341950636146688


#3 dTraderB

dTraderB

    Member

  • Traders-Talk User
  • 17,659 posts

Posted 21 August 2022 - 09:26 AM

One of my favorite SHORTS when it trades  above 900 .... soon, it will be even more favored when above 800 is a sure SHORT


Waiting... biding my time, again.... 


$TSLA Printing a blue doji so far this month right near May's high


#4 dTraderB

dTraderB

    Member

  • Traders-Talk User
  • 17,659 posts

Posted 21 August 2022 - 09:32 AM

So, what's new?

THIS: it is becoming a popular opinion


Roubini Sees Either US Hard Landing or Uncontrolled Inflation
 
OTH:
@JimPethokoukis
· Aug 16
JPMORGAN am trading note: "Tail risks diminishing post-CPI, sentiment improving for risk assets: signs that a peak in inflation is behind are growing, which reinforces the idea that Fed hawkishness is likely behind and a soft landing is increasingly likely."


#5 dTraderB

dTraderB

    Member

  • Traders-Talk User
  • 17,659 posts

Posted 21 August 2022 - 09:34 AM

Have a great weekend! Since July 2021, 4200 has been the bull/bear line in #ES_F:
Brokeout August 10. Now, bulls must hold to keep it going & stop deep sell
Next week: 4190-4200 likely tests. Another leg to 4330+ in play if it holds. 4190 fails, we sell to 4160, 4100.

https://twitter.com/...046797258203140


#6 dTraderB

dTraderB

    Member

  • Traders-Talk User
  • 17,659 posts

Posted 21 August 2022 - 09:37 AM


hN65_xGU_normal.jpg
 
I post an Excel file each day at https://mcoscillator.com/data/osc_data/OSC-DATA.xls with the past few months' McClellan Oscillator and Summation Index data (classic versions). Intraday, you can type in pretend A-D numbers to see what the Oscillator value would be if market closed with those numbers.


#7 dTraderB

dTraderB

    Member

  • Traders-Talk User
  • 17,659 posts

Posted 21 August 2022 - 09:54 AM

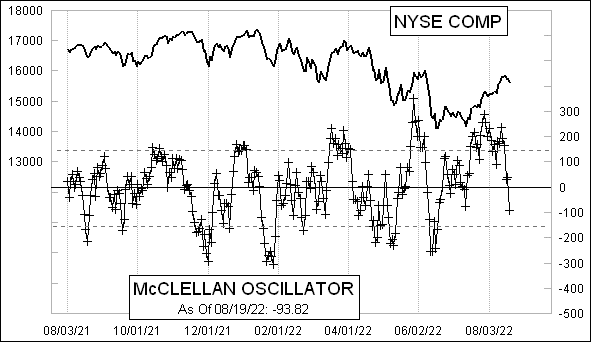
WOW! Sliced thru the ZERO like....


Down 130 on Friday; not a surprise


McClellanOsc_1367.gif


I post an Excel file each day at https://mcoscillator.com/data/osc_data/OSC-DATA.xls with the past few months' McClellan Oscillator and Summation Index data (classic versions). Intraday, you can type in pretend A-D numbers to see what the Oscillator value would be if market closed with those numbers.


hN65_xGU_normal.jpg
 
I post an Excel file each day at https://mcoscillator.com/data/osc_data/OSC-DATA.xls with the past few months' McClellan Oscillator and Summation Index data (classic versions). Intraday, you can type in pretend A-D numbers to see what the Oscillator value would be if market closed with those numbers.


#8 dTraderB

dTraderB

    Member

  • Traders-Talk User
  • 17,659 posts

Posted 21 August 2022 - 09:55 AM

SPX also dipped below the zero line


https://www.marketin...llan-oscillator


#9 dTraderB

dTraderB

    Member

  • Traders-Talk User
  • 17,659 posts

Posted 21 August 2022 - 09:56 AM

Did I say MARKETS on the EDGE?  Here is a graphical representation of this:


https://www.marketin...-highs-new-lows


SPX also dipped below the zero line


https://www.marketin...llan-oscillator


#10 dTraderB

dTraderB

    Member

  • Traders-Talk User
  • 17,659 posts

Posted 21 August 2022 - 09:57 AM

...and here:
https://www.marketin...e-decline-ratio


Did I say MARKETS on the EDGE?  Here is a graphical representation of this:


https://www.marketin...-highs-new-lows


SPX also dipped below the zero line


https://www.marketin...llan-oscillator