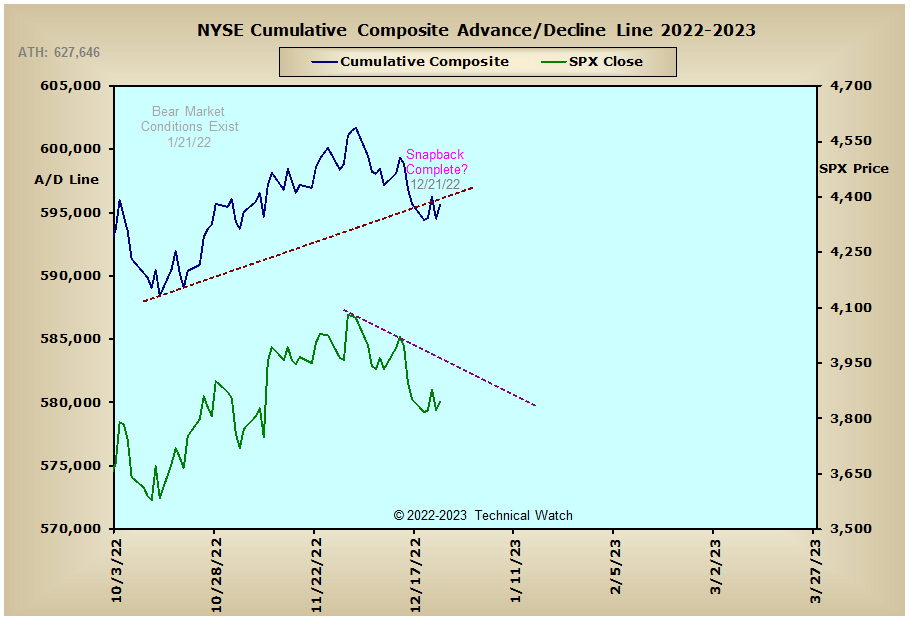
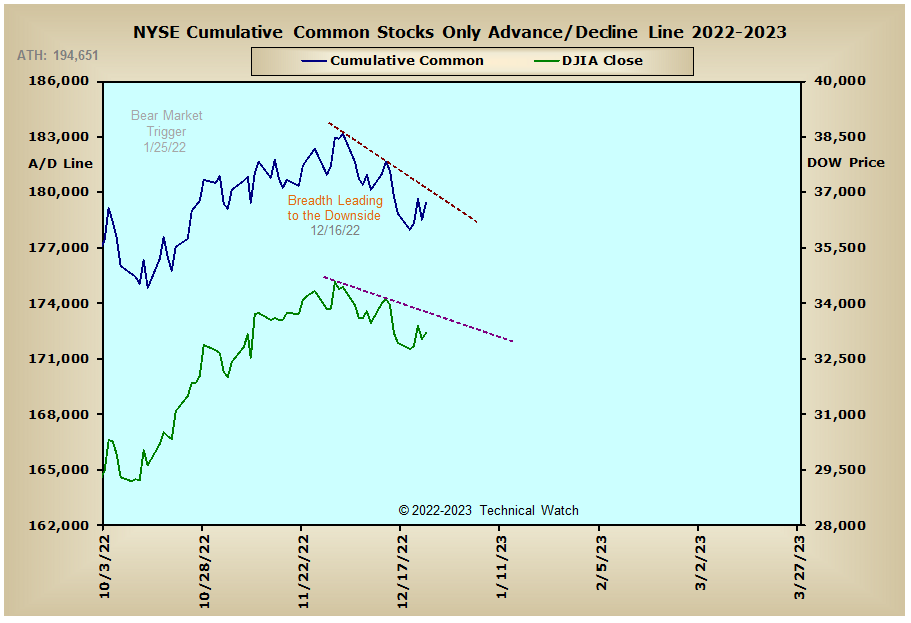
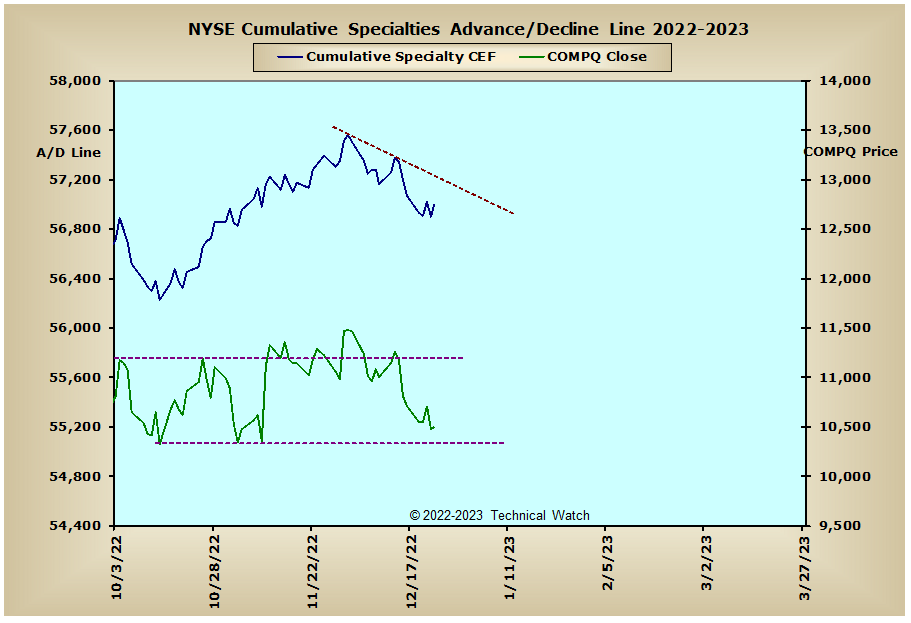
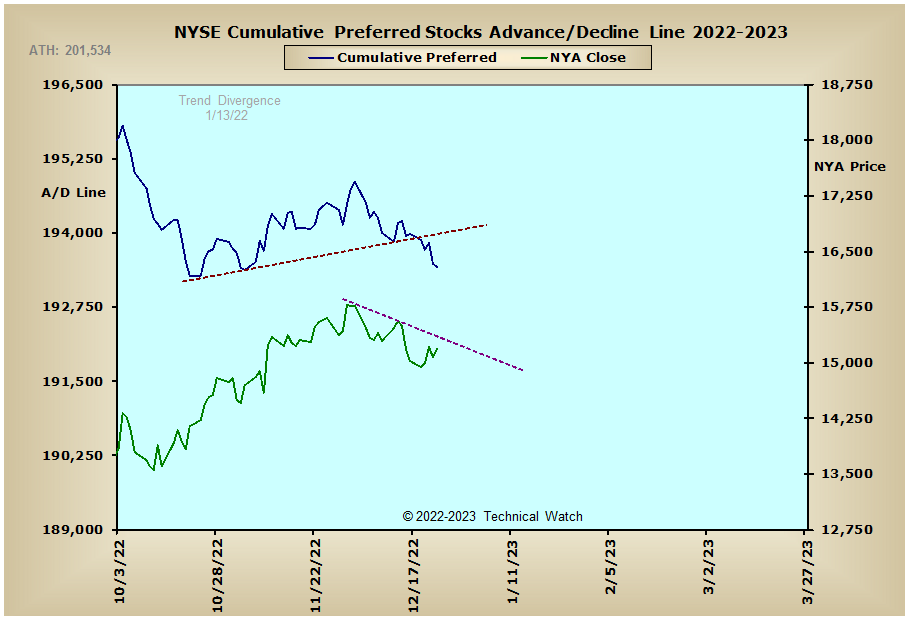
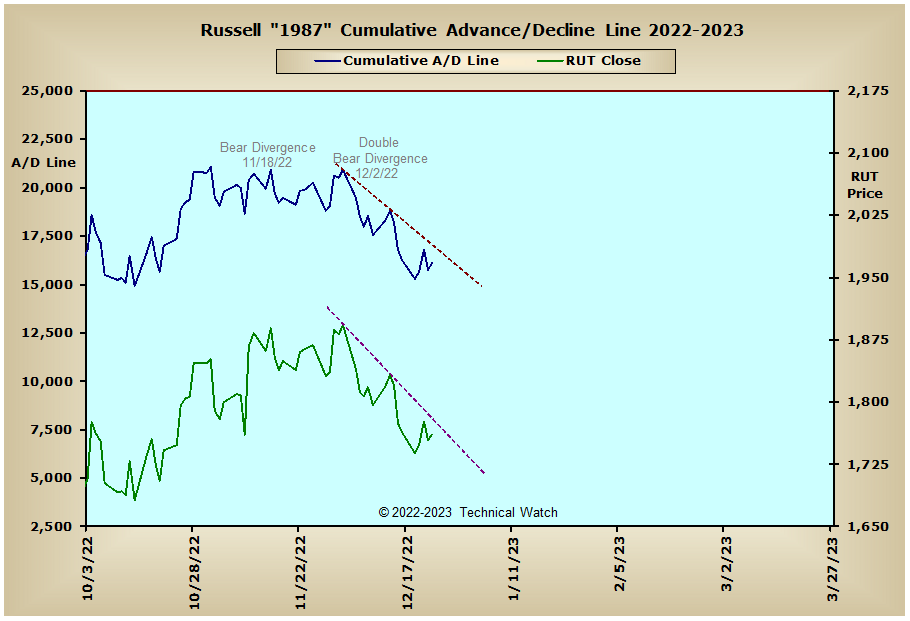
Please note that the time axis has been adjusted this week to provide better analytical value moving forward.
It turned out to be a choppy and somewhat volatile week of pre-holiday trading as the major market indices finished with only a slight average gain of +.19%. Once again the NASDAQ Composite Index continued to be the weakest link as it sunk another -1.94% after finding stiff price pattern resistance at the confluence of its 20 week and 200 week EMA's earlier this month. Friday's NASDAQ close is now within 175 points of its lows of the year that were seen back in mid October.
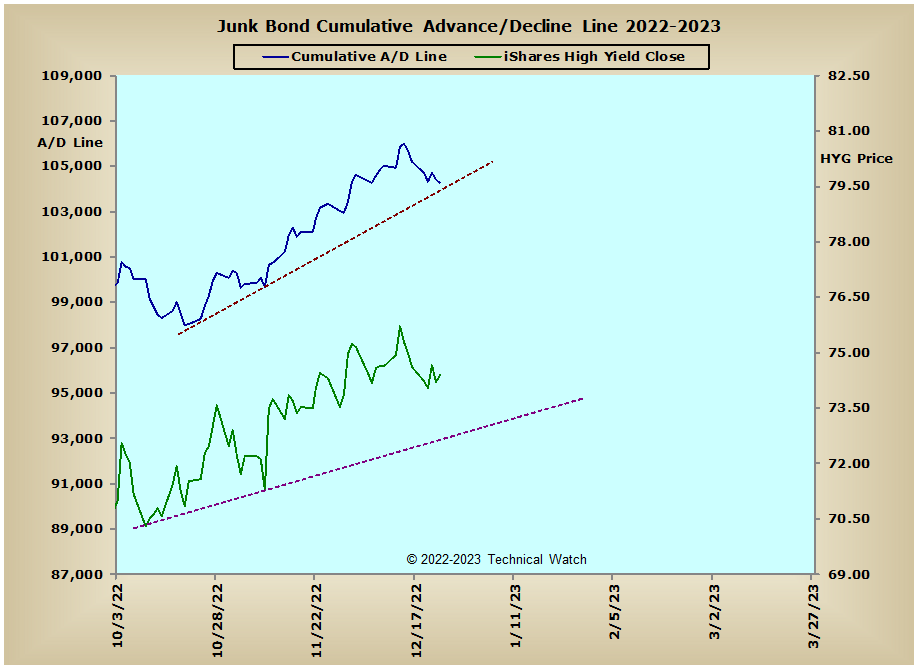
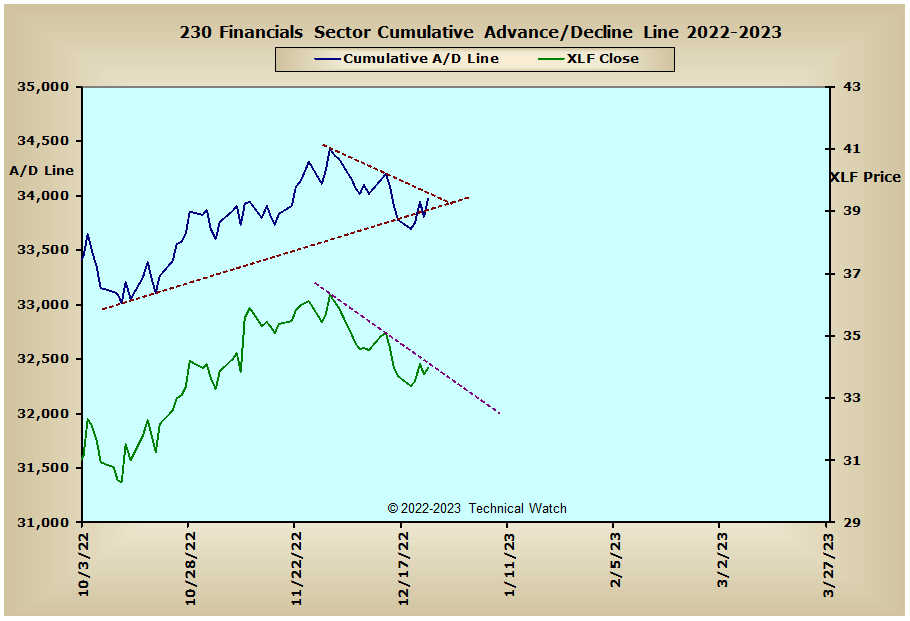
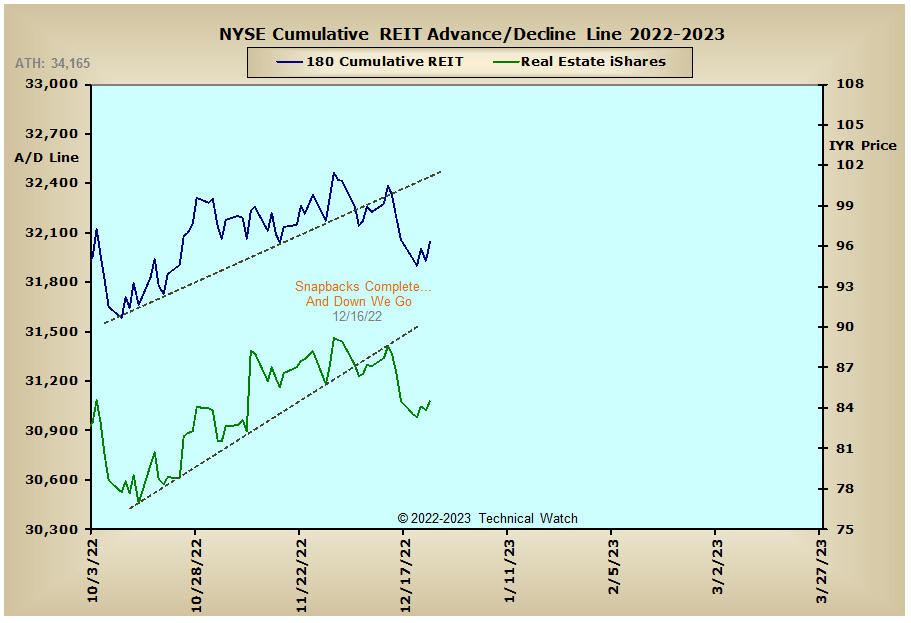
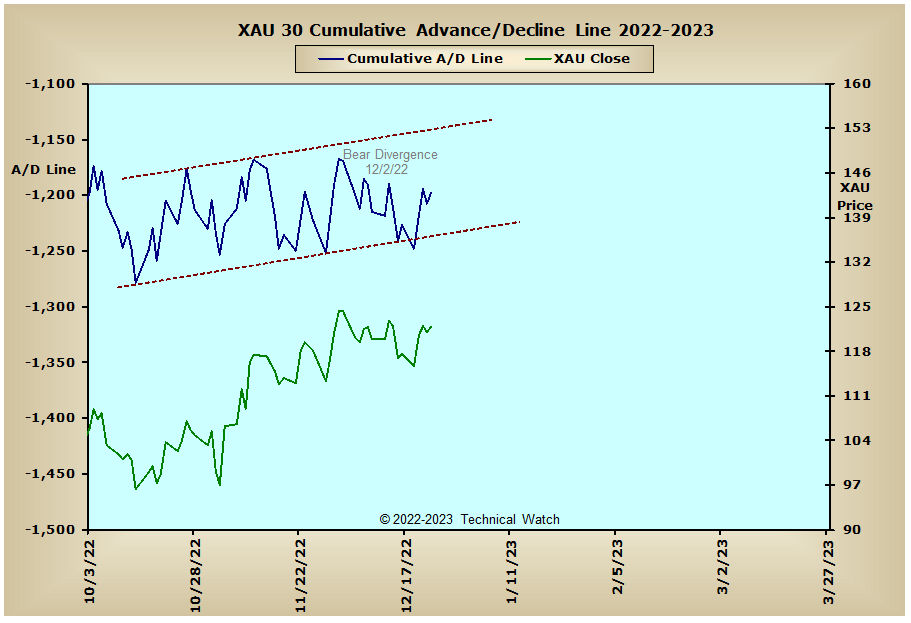
A quick review of our standard array of cumulative breadth charts shows that the equity related advance/decline lines continue to show a pattern of internal fatigue with the help of the interest rate sensitive advance/decline lines and their increasing weakness. Meanwhile, the Precious Metals and XAU advance/decline lines magically found support at the lower end of their two month channels that had the rhythm of a cyclical low, though with the current short term path of interest rates moving higher again, this will likely act as a deterrent for higher gold and silver prices as we begin the new year ahead. Not much in the way of analytical changes for the international markets last week, but the Bombay advance/decline line and the BSE 500 did see a break of their respective trendlines, which was then followed by accelerations in both to the downside.
So with the BETS finishing at its lowest levels since the October 13th price pattern lows at -70, traders and investors continue to work with a hostile market environment. With the large majority of breadth and volume McClellan Oscillators relieving their highly "oversold" readings from the week before, many of them also finished on Friday with higher reflex highs for the week. This would suggest some continued strength as we start things off on Tuesday, but once the technical obligation of having snapbacks to or toward the MCO zero lines is considered complete, there continues to be an increasing likelihood that the start of 2023 is going to be a weak one overall. The NYSE Open 10 TRIN finished on Friday at its lowest levels since the mid October lows at .96, while the NASDAQ Open 10's reading of .99 put it at the threshold of being minimally "oversold". In a statistical anomaly, the 10 day average of the equity put/call ratio finished on Friday at an all time high of 1.01 with records going back to 1998, while the CBOE P/C ratio concluded by almost matching the two year highs of last April at 1.15. With market internals continuing to be in a state of volatile flux, and the implied volatility of put premiums still reasonable, it's hard to imagine that these high levels of put buying are somehow screaming a sentiment bottom, so we'll continue to watch this closely as we finish off the year just in case this turns into nothing more than a "fat finger" event. In any event, the current blueprint for prices remains with a bearish bias as we finish off the month of December, and this will likely continue into January's OPEX event on the 20th. With all this to chew on then, let's continue to give any advantage to the sellers next week as end of year portfolio adjustments will likely have a heavy hand on the directional scale.
Wishing everyone a happy, healthy and prosperous New Year!
US Interest Rates: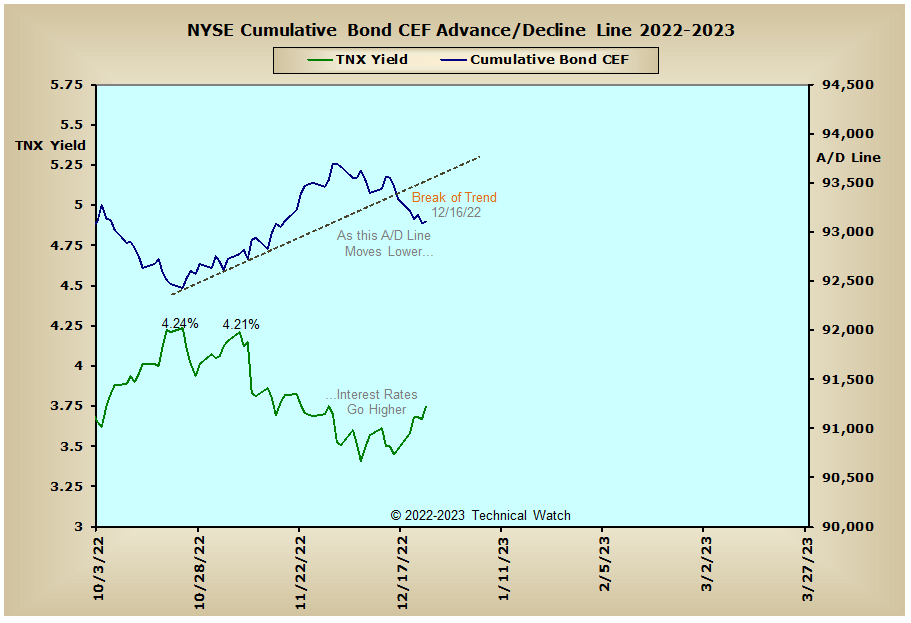
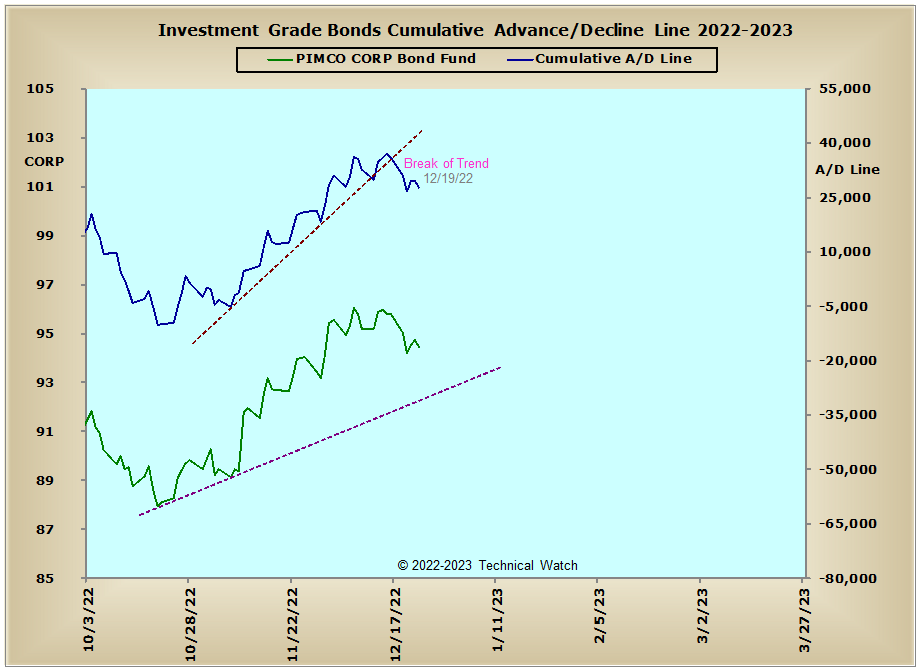
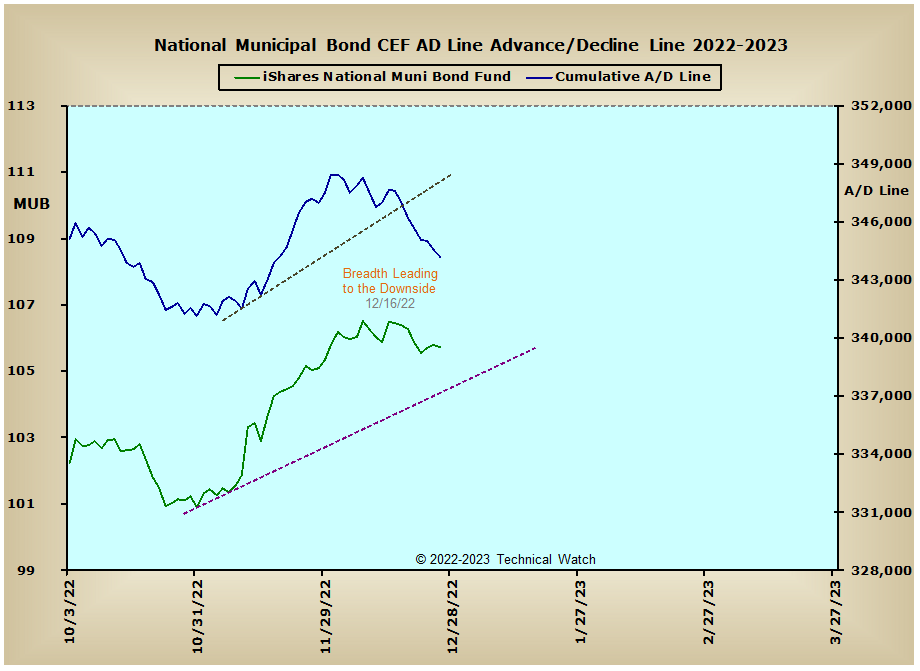
US Sectors: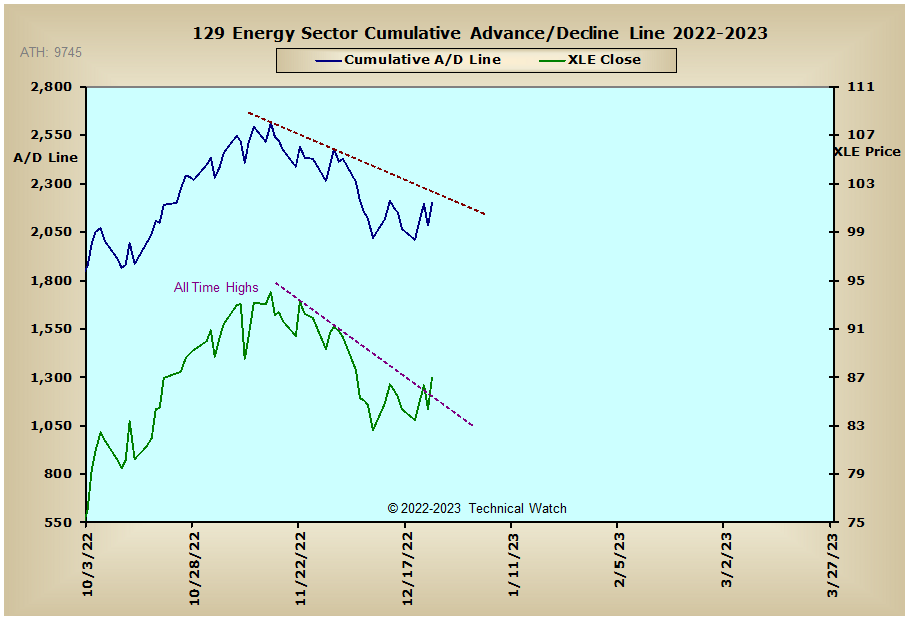
Precious Metals: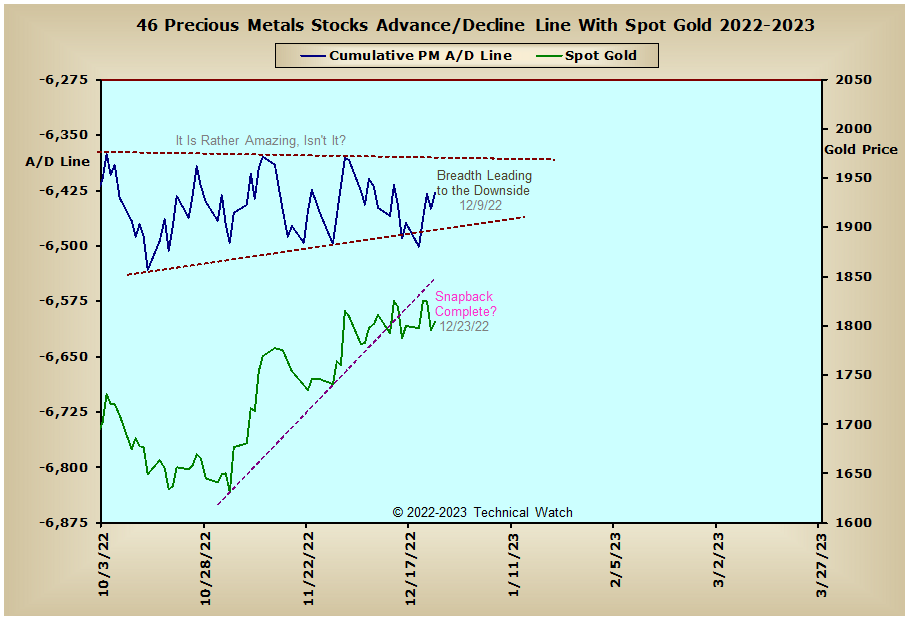
Australia: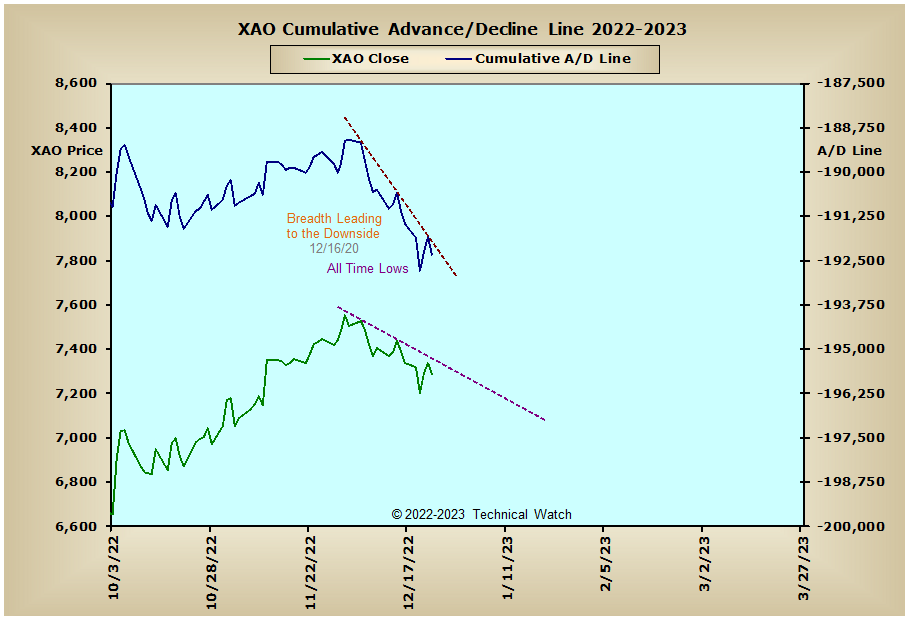
England: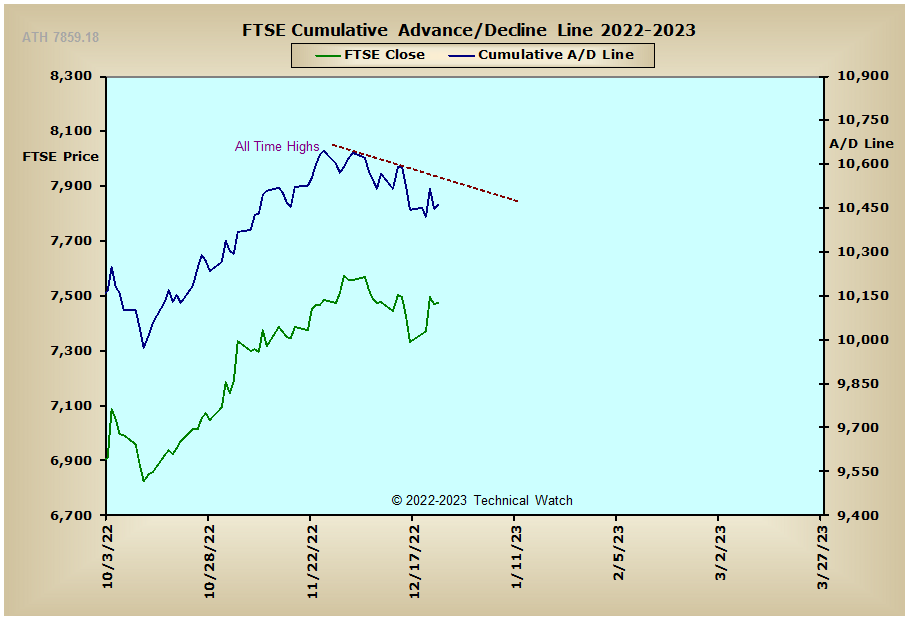
France: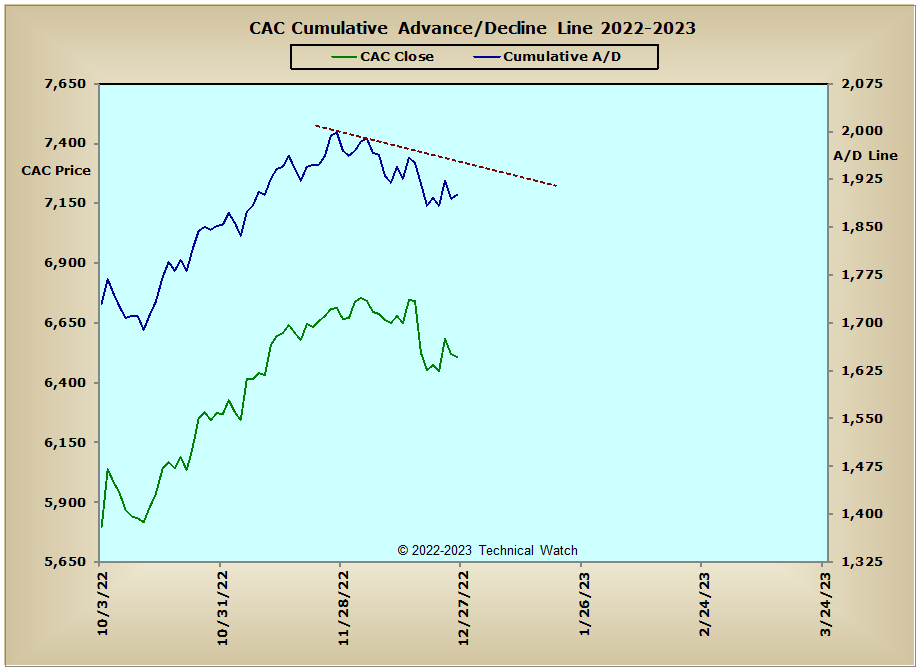
Germany: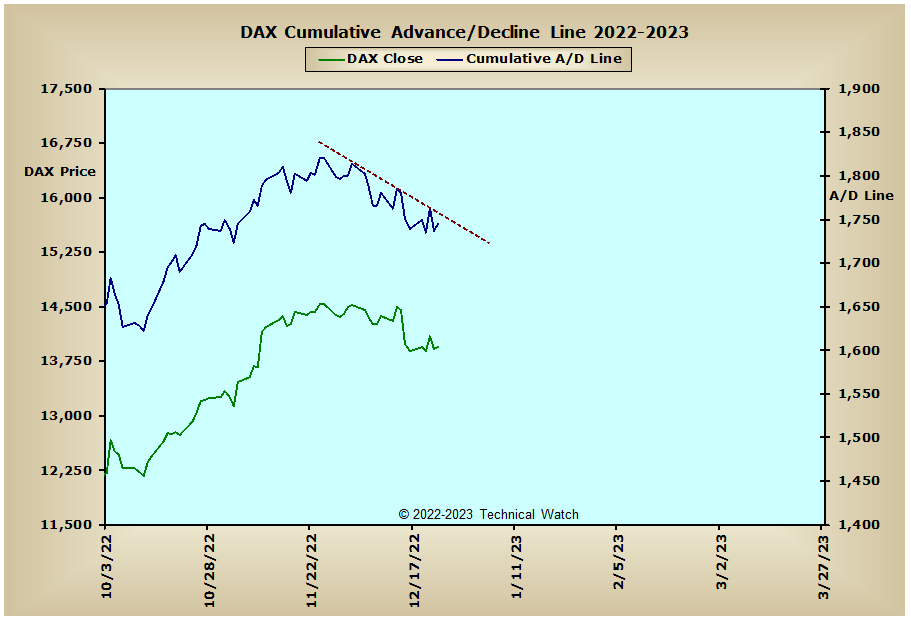
India: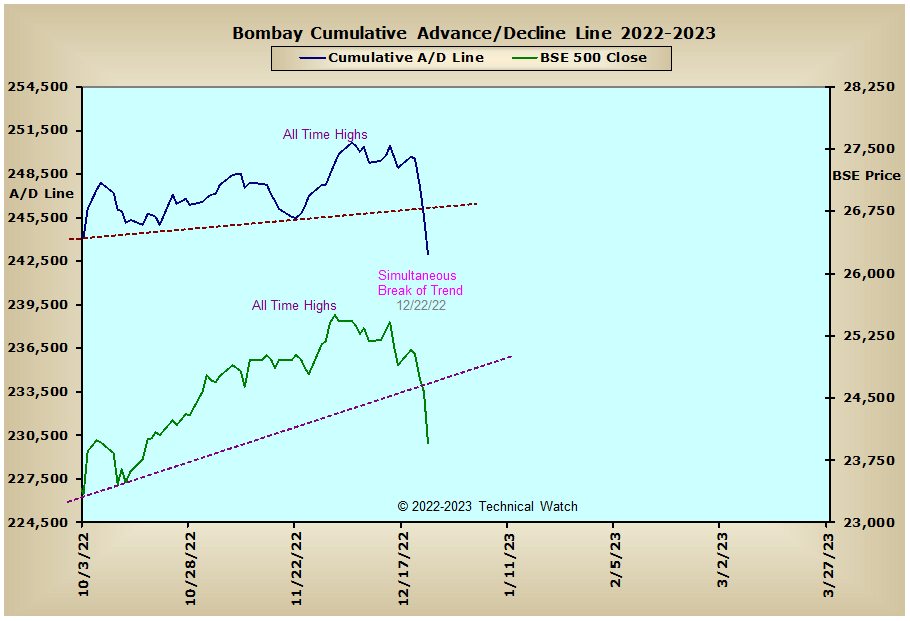
Edited by fib_1618, 30 December 2022 - 02:22 PM.


